http://www.machinerylubrication.com/Read/29407/oil-condition-monitoring
Electric conductivity is a measure of a fluid’s electrostatic chargeability. It usually is expressed in picosiemens per meter (pS/m). In addition to the type of fluid, conductivity also depends on the concentration of movable charge carriers. For example, pure distilled water is only slightly conductive. However, if the water contains impurities such as salts, acids or bases, then its conductivity increases.
Lubricants are normally only slightly conductive and therefore can work as insulators in transformers or switches. However, oils can also conduct electric current. Their conductivity is dependent on several different factors, including the base oil, additives and polarity.
 The lightly refined, mineral-oil-based base oils of Group I represent the simplest option and previously accounted for the largest proportion of lubricant production. Over the last few years, that proportion has been in steady decline, as the more refined base oils of Groups II, III and IV are increasingly being utilized for modern lubricants. This trend of using more refined base oils and synthetic alternatives is based on the fact that they generally have better characteristics such as higher aging stability. However, while the higher-quality base oils have many advantages, there are concerns over some of their changed properties, which can lead to problems, especially when unfavorable combinations occur. One such consequence is varnish, which can be due to the base oil’s altered dissolving performance with regard to aging and reaction products. Another consideration is component and lubricant damage, which can be caused by electrostatic discharges. The lubricant’s conductivity is an important factor in the charge buildup, and conductivity is dependent on the type of base oil used (see Table 2).
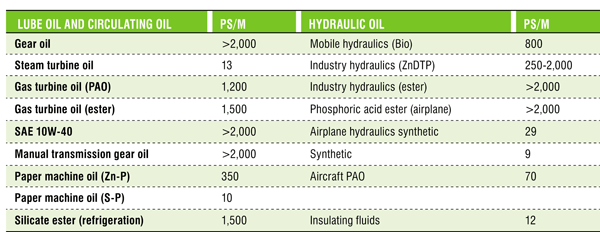
Table 2. Conductivity of oils and synthetic fluids at 23 degrees C (73 degrees F)
Along with the base oil, additives have a significant effect on an oil’s conductivity. The higher the proportion of metal-organic additives, the higher the lubricant’s conductivity. A prime example would be metal-organic additives such as those frequently used in zinc dithiophosphate (ZnDTP). As a proven multi-purpose additive in engine and hydraulic oils, ZnDTP improves wear and corrosion protection while simultaneously functioning as an antioxidant. However, zinc is considered to have dangerous health implications, so ZnDTP should be largely avoided. This means that the oil’s conductivity decreases and the risk of static charging increases.
A lubricant’s conductivity not only is influenced by the base oil and the additive package but also depends on temperature. The higher the temperature, the higher the oil’s conductivity. Unfortunately, there is no linear correlation between the two parameters, as each oil type has its own conductivity/temperature relationship. Furthermore, at a constant temperature, conductivity still changes during operation due to additive reactions, wear metals, reactions with metal surfaces, water and the formation of aging and oxidation products.
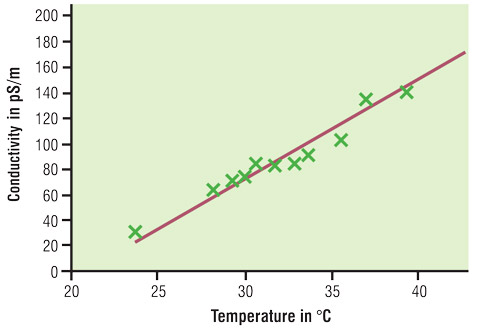
Figure 1. The relationship between lubricant conductivity and temperature
In oil-circulating systems, electrostatic charges generally can occur if there is friction in the flow between the oil and the surfaces surrounding it. The strength of the static charge depends on many different and partly interconnected factors. The energy density, which builds up in the system and leads to subsequent discharges, is contingent on the oil’s conductivity and volume flow. The more oil that flows through a circulation pipe and the lower the oil’s conductivity, the greater the potential for an electrostatic charge.
Oil can be especially electrostatically charged if:
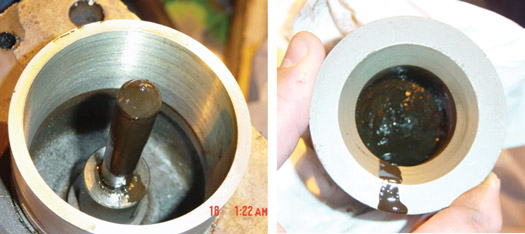
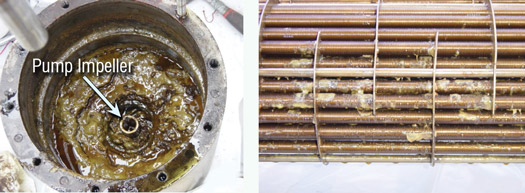
The microsparks caused by a static charge can lead to temperatures approaching 1,000 degrees C. This can be extremely dangerous if the fluids are even slightly flammable. In addition, if hydrocarbon vapors have formed in the tank ventilation area, the system could spontaneously combust. However, when discharge sparks occur within a turbine or hydraulic oil-circulation system, they are normally smothered very quickly by the oil. Nevertheless, these mini-explosions can burn holes in filters or even seriously damage the oil due to increased sludge buildup.
As mentioned previously, oil’s conductivity value is measured in pS/m. If the conductivity is more than 400 pS/m at 68 degrees F (20 degrees C), there is little risk of damage to the oil or the system from electrostatic charges. However, if the value is lower, there is a very real possibility that the phenomenon could occur.
If an oil with an increased ESD risk is being used, grounding the entire system is not a viable option. The voltage inside the system cannot be discharged through a grounding wire. Fortunately, there are several other approaches for prevention.
Lubricants are normally only slightly conductive and therefore can work as insulators in transformers or switches. However, oils can also conduct electric current. Their conductivity is dependent on several different factors, including the base oil, additives and polarity.
Oil Conductivity
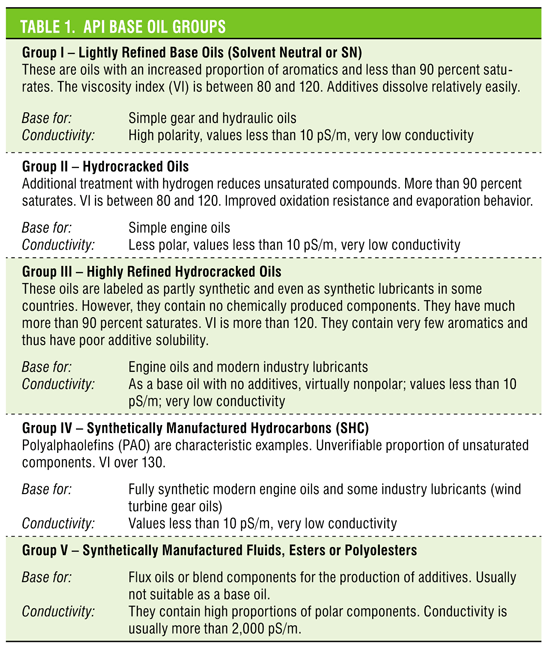
The more polar a lubricant is, the less refined and more conductive it is. Based on the manufacturing method and level of refining, the American Petroleum Institute (API) has classified base oils into five groups (see Table 1).Table 2. Conductivity of oils and synthetic fluids at 23 degrees C (73 degrees F)
A lubricant’s conductivity not only is influenced by the base oil and the additive package but also depends on temperature. The higher the temperature, the higher the oil’s conductivity. Unfortunately, there is no linear correlation between the two parameters, as each oil type has its own conductivity/temperature relationship. Furthermore, at a constant temperature, conductivity still changes during operation due to additive reactions, wear metals, reactions with metal surfaces, water and the formation of aging and oxidation products.
Electrostatic Charges
Although monitoring conductivity so far has been unable to achieve much success in the area of sensor technology, it is gaining significance with regard to electrostatic charges and discharges in lubricant and hydraulic systems.Figure 1. The relationship between lubricant conductivity and temperature
Oil can be especially electrostatically charged if:
- It is formulated with a base oil from Group II or III.
- It contains no polarizing (zinc-containing) additives.
- The conductivity of the new or old oil is less than 400 pS/m.
- It is fed into pipes that are too small.
- It is moved with too high a flow velocity.
- It produces friction in poorly designed filter elements.
- Pipes and hoses are not grounded.
- The oil level has dropped too low.
- It contains high proportions of undissolved air (bubbles).
Electrostatic Discharges and Possible Consequences
If the level of electric charge in the system becomes too great, an electrostatic discharge (ESD) will occur. In such cases, microsparks or sparking results. Typically, a crackling or clicking sound will be heard near the filter or in the tank. If the charge is high enough, the discharge could be repeated several times in quick succession. Discharges primarily take place in areas with vastly different material combinations. Modern filters with a high proportion of plastic are often affected.The microsparks caused by a static charge can lead to temperatures approaching 1,000 degrees C. This can be extremely dangerous if the fluids are even slightly flammable. In addition, if hydrocarbon vapors have formed in the tank ventilation area, the system could spontaneously combust. However, when discharge sparks occur within a turbine or hydraulic oil-circulation system, they are normally smothered very quickly by the oil. Nevertheless, these mini-explosions can burn holes in filters or even seriously damage the oil due to increased sludge buildup.
Effects on Turbine and Hydraulic Oils
In recent years, electrostatic charges and discharges have been occurring more frequently in turbine and hydraulic oil systems. Several developments are responsible for this, including:- Modern hydraulic fluids and turbine oils have become increasingly less conductive because of the global trend to use modern base oils and additives. Previously, turbine oils were based on relatively conductive, lightly refined Group I base oils. Currently, more oxidation-resistant, better refined Group II base oils or even partly synthetic Group III base oils are being used, especially for gas turbine oils. These oils are considerably less conductive. In addition, turbine oils normally contain very few metal-organic additives, which help to prevent the formation of unwanted deposits (varnish).
- New systems feature a more compact design with a considerably smaller tank capacity and a proportionally larger displaced volume.
- Oil purity requirements have increased. This in turn has led to higher filtration rates.
- The filtration intensity and electrostatic charge properties of the oil (resulting from filtration) have increased.
- The oils’ low conductivity, which often is far below 1,000 pS/m in certain conditions, has resulted in an increased tendency for electrostatic charging.
Measuring Conductivity to Prevent Damage
In order to prevent damage from electrostatic discharges, more than just the conductivity of new oil must be identified. The parameter is also important for older lubricants, especially when dealing with larger quantities, if nothing is known about the used oil or a burning smell or soot particles are noticeable. Therefore, some oil analysis laboratories now offer conductivity measurements at different temperatures. The process has been tested for several years and is conducted in accordance with ASTM D2624. It originally was developed for inspecting airplane kerosene to avoid accidents caused by jet fuel charging.As mentioned previously, oil’s conductivity value is measured in pS/m. If the conductivity is more than 400 pS/m at 68 degrees F (20 degrees C), there is little risk of damage to the oil or the system from electrostatic charges. However, if the value is lower, there is a very real possibility that the phenomenon could occur.
If an oil with an increased ESD risk is being used, grounding the entire system is not a viable option. The voltage inside the system cannot be discharged through a grounding wire. Fortunately, there are several other approaches for prevention.
4 Ways to Prevent Electrostatic Problems
- Install special stat-free filters instead of conventional filter cartridges. These filters can discharge or even prevent the charge from occurring.
- Use an oil with a different makeup and higher conductivity value.
- Choose or modify the system’s material combinations so microspark formation is prevented despite an electrostatic charge.
- Optimize flow diameter, tank hold times or tank volumes to minimize the charge potential.