Friday 30 September 2016

Partnering for Continuous Improvement

Article extract from ReliablePlant newsletter:
http://www.reliableplant.com/Read/29106/continuous-improvement-partnering

A major U.S. manufacturer of fabricated steel and metal products was experiencing a troubling and ongoing series of bearing failures on a dual line used for coating operations. A critical bearing located on the outboard roll of the dual line’s cleaning section would fail, necessitating repeated replacement. This occurred six times over the short period of four months, resulting in unscheduled downtime (to replace a failed bearing time after time) and lost productivity.

The bearing was the subject of frequent monitoring, with vibration analysis showing no readily detectable problems (all spectra appeared good). Nevertheless, it was only a matter of weeks before the latest replacement bearing took its turn for the worse and for reasons unknown.

Determining the root cause of the problem and arriving at a solution ultimately resulted from a unique three-way relationship between the steel manufacturer, on-site reliability engineers and locally based industry specialists (a team of highly trained engineers specializing in specific industries). Both the reliability engineers and locally based industry specialists, working hand in hand, had already become invaluable on-site resources for the operation, serving as intrinsic members of the manufacturer’s maintenance staff – regularly attending maintenance planning and scheduling meetings, convening with the customer’s reliability manager, and contributing input and suggestions along the way regarding optimized machinery health throughout the plant.

In this case, reliability engineers tagged the “bad actor” (failed bearing), and the industry specialists performed in-depth detective work into the root cause of failure. The conclusion was that the bearing was failing due to the roll’s thrusting in an axial direction, which the particular type of bearing could not accommodate. After documenting that the installed bearing could be suitably replaced by a more appropriate toroidal roller bearing that was specially designed to handle axial displacement without inducing additional axial forces of friction, a switch was made. In addition, a more suitable lubrication recommendation was adopted. The line has been running smoothly ever since without a bearing failure or process interruption. Value added over mean time between repairs (MTBR) to this steel producer was more than $230,000 in the first year, with cash flow breaking even in one month.

While this represents an example of how various bearing technologies can solve particular operational challenges, the compelling story runs much deeper and is illustrative of a trend that is gradually shifting the reliability landscape into a new territory – light years ahead of the conventional (and reactive) practice of engaging maintenance expertise only after the fact.

This case especially demonstrates how an operation can elevate reliability partnerships to an entirely new level by teaming with reliability and engineering professionals who become integral members of an organization’s maintenance framework. The on-the-scene professionals serve as focused sets of “eyes and ears” – supported by an array of relevant resources and expertise – to identify and diagnose machinery health problems, propose incisive recommendations to solve them, document all findings in writing, tally anticipated savings and efficiencies to substantiate the efforts, and make necessary fixes just in time.

This innovative approach (and advanced alternative) to traditional predictive maintenance practices effectively re-casts “supporting” players into the role of highly involved team players dedicated to the success of an operation’s initiatives for continuous improvement.

Creating Value

Advantages of this approach can extend well beyond the basic capability to make immediate, timely and long-term fixes to machinery assets.

First and foremost, while partnerships between operations and expert resources have always been recognized as critical to the success of reliability programs, the inclusion and participation of experts as actively involved members of an existing maintenance team can help to dramatically improve communications, advance relationships and knowledge, and result in newfound improvements in the health of assets across the board. Committed and sustained partnerships among all players will contribute significantly to the success of any reliability program and create value along the way.

Among value-created opportunities, this approach opens the door to readily available root-cause analysis – digging as deeply as necessary into machinery health problems to identify the true culprit(s) and take the appropriate remedial action(s). This practice goes well beyond those employed during typical predictive maintenance activities and can help prevent problems from recurring and taking productivity down with them.

Such improvement initiative programs can further benefit operations by introducing a training element for maintenance staff to equip them with insights into relevant procedures and technologies to help lower the total cost of operations and to recognize – and remedy – a problem when they detect one. Routine maintenance procedures can be improved, too, as maintenance education and awareness expand and new technologies are put into play.

For example, a U.S. taconite mining operation has partnered with a dedicated team of reliability engineers and locally based industry specialists with powerful results. The engineers conduct weekly predictive maintenance “routes” throughout the operation, provide reports advising machine conditions and recommended actions, and recover or preserve failed components (such as bearings) accompanied with a detailed history of the failure(s).

In turn the industry specialists, who are well versed in the mining field, perform damage analysis, report and document the root cause, and recommend improvements designed to eliminate repetitive failures. The specialists additionally provide on-site training associated with bearing and seal installations, as well as support during installations – all of which are highly valued by the mine.

Specific project successes at this site included the following:

• Root-cause failure analysis showed that conveyor pulley bearing failures were being caused by the ingress of contaminants and were resolved with an improved sealing system.

• Mill pinion bearing failures were linked after analysis to poor support for the bearing and ingress of contaminants, and were remedied with a recommended improvement to the bearing housing fit, custom sealing system solution, and pinion rebuild and replacement overseen by the industry specialists.

• Dust-collector fans suffered from poor installation practices, and training was subsequently provided to demonstrate the proper use of a hydraulic assist for installation (consisting of a hydraulic nut, hydraulic pump and dial indicator).

Making the Grade

While this real-world demonstration of teamwork can help reap measurable rewards from improved asset reliability, increased machinery uptime and enhanced productivity, such initiatives will be highly dependent on the level of expertise and the extent of a reliability partner’s experience, capabilities, and supporting resources and technologies.

Among the questions to ask when beginning the selection process for a reliability team to help realize optimized results consistent with a viable continuous improvement initiative include:
• Can knowledge and experience specific to your industry be demonstrated?
• Are the provider’s supporting resources (from technologies and services to analysis and training) sufficiently extensive?
• Does the provider understand how reliability influences the life-cycle management of assets?
• Can the team respond quickly when machinery problems unexpectedly occur?
• Can the team seamlessly blend with the existing maintenance function?
• Will written documentation on problems and recommended solutions be part of the package?
• Will the provider be suitably equipped to support equipment fixes?
• Can the provider demonstrate a close relationship with distributor sources to supply solutions in a timely manner when required?
• Will program progress be measured in a meaningful way? How?
• Will total cost of operations be demonstrably reduced over time?

The answers to these (and related) questions can help guide decision-making when selecting a reliability partner best equipped to sustain a continuous improvement initiative and accrue both immediate and long-term benefits for any operation.

About the Authors
Andy Rein is the director of SKF Reliability Systems and is based in Schaumburg, Ill. He can be reached via e-mail at Andrew.Rein@skf.com. James A. Oliver is the director of sales support engineering for SKF USA Inc., with headquarters in Lansdale, Pa. Contact James atjames.a.oliver@skf.com.

An Effective Way to Drive Improvement

Article extract from ReliablePlant newsletter:
http://www.reliableplant.com/Read/29102/effectively-drive-improvement

When I think of planning, I always remember a quote that is attributed to Abraham Lincoln. "Give me six hours to chop down a tree, and I will spend the first four sharpening my axe." The point is that if you spend adequate time preparing to do the job, the job itself will go much smoother/better/faster.
There is a process for driving improvement and alignment called the PDCA cycle. PDCA stands for plan, do, check and act. It is a great approach to any business challenge. In very simple terms:

Plan
  • What do we want to do?
  • What do our customers want us to do?
  • Why is it important?
  • What are the steps we are going to use to actually move it?
  • What process will be needed? (Hint: Lean Six Sigma).
Do
  • Communicate that the plan exists and why it is important.
  • Make the plan visual using graphs, charts and scoreboards.
  • Explain what the organization needs to do to be successful and clearly define what success “looks like.”
  • Execute the plan.
  • Chart where the progress is vs. where we want it to be.
Check
  • Evaluate that the plan is yielding the results you intended.
  • Provide team updates and progress reports.
  • Include this on all monthly and quarterly reports.
  • Communicate and post the results to date on the visual boards.
  • Celebrate and communicate success as you find it.
  • Hold people accountable for the progress.
Act
  • Refocus on areas where progress is not up to par.
  • Adjust the plan if the success isn’t in line.
  • Add or take away from the plans if/when the business needs change.

Throughout the year, there should be information moving through the organization from senior management to the shop floor and vice versa. As business needs change, some of the metrics and measures might also need to change. As the improvements are made, the results need to be included in the information being shared. This creates a very clear and reliable source of alignment to again reinforce the need to keep all resources pointed in one direction.
A few summarizing thoughts about using PDCA:
  1. This clarity of purpose will drive the organization to improve those key metrics that are most important to the customer.
  2. The alignment of the effort drives synergy, teamwork and ownership.
  3. The communication helps break down walls and focus the organization on the right parts of the business.
  4. The combination of these items will most certainly yield high-impact results.

What You Should Know About Environmentally Friendly Lubricants

Article extract from ReliablePlant newsletter:
http://www.machinerylubrication.com/Read/29229/environmentally-friendly-lubricants

Buzzwords like biodegradable, bio-based, eco-friendly, renewable, non-toxic, green, etc., are often heard echoing throughout industry. Over time, these words have become powerful tools and selling points for lubricant manufacturers and marketers. However, they can also be misleading.

Along with legislative compliance, one of the reasons for this recent green initiative is the growing awareness and demand to use more environmentally safe products. The fact that petroleum-derived mineral stocks have finite resources has also created a pressing need to find alternative/renewable sources.

While there is no universally accepted definition for environmental safety, factors like biodegradability, eco-toxicity, bio-accumulations and renewability must be taken into consideration when accounting for the safety of the environment. Lubricants, by virtue of being petroleum based, have been classified as being of environmental concern. In the past, large quantities of industrial lubricants have been irresponsibly disposed of into the environment as used oils and spills or accidentally, which is a matter of grave environmental concern requiring immediate attention.

There are two basic approaches for dealing with environmental safety with regards to lubricants. The first is to find ways to eliminate the disposal of lubricants into the environment. The second is to use environmentally safe products in environment-sensitive applications such as agriculture, forestry, municipalities, mining, marine, etc.

In addition, the different terms floating across industry to measure/evaluate environmentally safe products are not well-defined and need better understanding.

Biodegradable

In simple terms, biodegradable refers to the chemical degradation of a substance (lubricant) in the presence of micro-organisms/bacteria. Although there are different definitions of biodegradability across industry, perhaps one of the most reasonable is found in ASTM D6064, which describes biodegradability as “a function of degree of degradation, time and test methodology.”

There are two generally used measurements for biodegradability. The first is primary degradation, which is measured as the reduction of the carbon-hydrogen bond. This is determined with infrared spectroscopy (IR), which corresponds to the direct measure of the percentage of lubricant breakdown. The most widely used way to measure this degradation is by the Coordinating European Council (CEC) L-33-93 test method run for 21 days.

The other type of biodegradability measurement is secondary degradation, which is better known as ultimate biodegradability. This measures the evolution of carbon dioxide through the degradation process over a period of 28 days. The most common method used to determine ultimate biodegradability is by the Organization for Economic Cooperation and Development (OECD) 301B/ASTM D5864.

The benchmark for qualifying a lubricant as biodegradable is if its biodegradability is more than 80 percent by the CEC L-33-93 method or more than 60 percent by the OECD 301B method.

Bio-Based

Bio-based is a term that was mainly coined in the United States and based on the necessity to derive renewable products from vegetable/plant/animal-based materials. The industry or regulatory authority (USDA) did not intend for bio-based to imply a 100-percent vegetable oil-based formula, as other non-bio-based ingredients might be necessary to meet industry performance standards. The USDA and other regulatory/industry organizations have established that the use of 50 percent or more bio-based material in a formulation could allow a product to be considered bio-based. Thus, the more accepted definition of bio-based lubricants would be those products formulated with a majority of renewable and biodegradable base stocks.

For example, fatty acids used in making grease thickener components qualify as bio-based even though they are not biodegradable. Therefore, bio-based products may not necessarily be 100-percent biodegradable, but they must be agro-based and renewable.

Green

A synonym for being environmentally friendly, green is probably one of the most attractive terms in industry, yet it often can be misleading. Some products that are not even based on vegetable oil may still be marketed as environmentally friendly lubricants. While these types of lubricants may be free of heavy metals and other potential toxic ingredients, they are not biodegradable. Consequently, it’s important to be careful when selecting such products and to be aware that green does not necessarily mean biodegradable. Just being a green color or free from heavy metals does not make a product environmentally friendly in the real sense. This requires being biodegradable or derived from renewable sources.


Theoretically, environmentally safe products are those that degrade quickly and naturally with non-toxic decomposed fractions and that are based on renewable sources. These lubricants must be formulated with renewable/vegetable oils in majority, readily biodegradable and free from heavy metals and other toxic ingredients/byproducts.

Performance Comparison

Environmentally safe products offer certain performance advantages. When formulated with vegetable oils, these lubricants exhibit better lubricity, which means reduced friction and wear, a high viscosity index and high flash points for improved safety.

The inherent drawbacks associated with these types of products include their limited high-temperature capabilities as a result of inferior oxidation and thermal stability, restricted low-temperature applicability due to higher pour points, and poor pumpability at sub-zero temperatures. As these lubricants are expected to degrade over the course of time in the presence of oxygen, their shelf life also is limited and does not compare with that of mineral/synthetic oils.

Another aspect that should be considered when switching to vegetable oil-based greases is their compatibility with mineral oil or synthetic oil-based greases. Recent studies indicate that some vegetable oil-based greases have been found to be incompatible with mineral oil-based greases due to the chemistry differences between vegetable and petroleum oils.

While our knowledge of environmental safety is still in its early stages, more concerted efforts are needed to clearly define the related terms. If choosing vegetable oil-based environmentally friendly lubricants, keep in mind that there are dual objectives to fulfill, with one being environmental safety and the other the quest for alternatives to petroleum base stocks. The future of these classes of lubricants will greatly depend on how these disadvantages are overcome while still being competitive in price.


About the Author
Dr. Anoop Kumar is the director of research and business development at Royal Manufacturing. He has more than 20 years of experience in the field of lubricants and greases, along with a doctorate ... 

Thursday 29 September 2016

Assess Your Value, Unique Contribution

Article extract from ReliablePlant newsletter:
http://www.reliableplant.com/Read/29098/your-value-contribution

As an instructor for the U.S. Postal Service, I often taught classes where 40 executives would spend two weeks at our executive center learning about all functions of the company and gaining a familiarity with the business of business. More than once, an executive would ask me what the cost of this experience was to the company. Now, the direct costs were easily calculated, so I would follow up with "What costs besides travel costs?"

These people were asking about the loss of effectiveness to their organization due to their absence. They were serious, and I was aghast at their presumption. In truth, their operations probably breathed a sigh of relief, and effectiveness likely increased. That was when I was much younger and still had some innocence.

Since then, I have had opportunities to address groups of all sizes on employee motivation, leadership development, actionable metrics, process improvement, etc. I am most interested in helping people learn about themselves as the first step toward helping others to grow.

I employ a simple exercise during a presentation, couched as a stretch-the-legs exercise. I ask all attendees to stand up. Then, I begin a little audience participation. I ask that those who believe things at home will not go as well while they are at this meeting to sit down.

I then ask those who believe that a full week’s absence will have no effect or loss to output to sit down. Then two weeks, then four weeks … OK, how about six weeks? With about 15 percent of the audience standing, I then ask all to sit down.

"Each of you has defined what you perceive to be your value point for your organization. This is where you decided that your unique contribution to the company comes into play." Each of the attendees has a unique situation by which they may rationalize their value point, and indeed it could be situational. The message here is that some managers were standing at six weeks. What could each person individually do to revise his or her value point? How do people define their unique contribution(s)?

In studying management, Peter Drucker brought up the concept of a person's "unique contribution" to his or her company. This is what identifies that person’s value. It could be unique experience, knowledge, passion, talent, relationships, skills, abilities, interpersonal abilities, political savvy, etc. Is it truly unique? Will it pigeon-hole the person or affect his or her career? What effect does it have on the person's subordinates, peers or superiors? How does he or she exploit it (for power, to destroy or to help)? What happens if this person was hit by a truck and lost to the organization?

In "Leadership is an Art," author Max De Pree tells about the retirement of a college custodian. Several hundred people showed up, and selected former students spoke. All present testified to the effect this custodian had on their lives. He was a true listener with an understanding heart who always had time for students. His gift was an ability to guide students to make their own decisions and develop their confidence as directors of their own lives. The speakers included a general, CEOs and "regular" folks.

What was his unique contribution and how did he use it? What was his value point? Do you use your unique contribution as the custodian did?

Remember, humility trumps pride.

Identifying Root Causes of Machinery Damage with Condition Monitoring

Article extract from ReliablePlant newsletter:
http://www.machinerylubrication.com/Read/29230/condition-monitoring-machinery

Why do some machines fail early, while others operate for many additional years? Generally, eight mechanisms lead to component failures in industrial machinery: abrasion, corrosion, fatigue, boundary lubrication, deposition, erosion, cavitation and electrical discharge. These mechanisms are driven by various forces, reactive agents, the environment, temperature and time. Through monitoring the condition of your machinery and applying appropriate measurement technologies, it is possible to reveal the existence of these damaging mechanisms in order to take proactive or predictive measures and prevent failures.

4 Key Failure Mechanisms

Four wear mechanisms are commonly associated with the majority of root causes that lead to component failures of industrial machinery: abrasion, corrosion, fatigue and boundary lubrication. The latter is related to adhesion and other sliding wear modes.


Root causes and common mechanisms affecting wear of industrial machinery.


Abrasive wear particles


Abrasion

Abrasive wear is usually a result of three-body cutting wear caused by dust contamination of the lubricating oil compartment. Dust, which is much harder than steel, gets trapped at a nip point between two moving surfaces. The trapped particles tend to imbed in the relatively softer metal and then cut grooves in the harder metal. This is akin to the process by which sandpaper cuts steel. The lubricating fluid minimizes friction and adhesion, effectively improving the cutting efficiency of the abrasive particles during subsequent revolutions of the machine components.

Abrasion involves localized friction, which produces high-frequency stress waves that propagate short distances through metals. Stress-wave energy can be detected using high-frequency stress-wave analysis techniques such as Emerson’s PeakVue™ technology. Control of particle contamination in the lubricant system should be employed to remove particle debris from the system while minimizing dust ingression through air breather ports, seals and incoming lubricants. Establishing target cleanliness levels based on particle counting measurements, such as those specified in ASTM D7416, D7647 and D7596, is essential in controlling particle contamination.

Abrasive wear particles look like the cuttings often found on the shop floor under a lathe. Sometimes these particles are described as ribbons. Wear particle analysis (WPA), as guided by ASTM D7684 and using techniques explained in ASTM D7416 and D7690, can be quite effective for probing these particles. Wear particle detection and classification as defined in D7596 may also be helpful.

Corrosion

Corrosion is a chemical reaction that is accelerated by temperature. The Arrhenius rate rule suggests that chemical reaction rates double with each increase in temperature of 10 degrees C. Corrosion of metal surfaces tends to be somewhat self-limiting because metal oxide forms on surfaces to a finite depth. Oxide layers are very soft and rub away easily. Rubbing exposes underlying metal and permits deeper penetration of oxidation in the presence of oxidizing corrosive media.

Corrosive wear is typically caused by moisture or another corrosive liquid/gas. Such process acids or carboxylic acid formations may be produced during lubricant degradation due to exposure to oxygen under elevated temperatures. When these media are entrained in the lubricant, metal surfaces tend to oxidize.


Corrosive wear particles

Sensing methods for detecting corrosive substances in oil include Karl Fischer titration, time-resolved dielectric (ASTM D7416), infrared spectroscopy, acid number (AN) and base number (BN). Corrosive wear debris in oil is best recognized using spectrometric oil analysis (SOA) such as rotrode (ASTM D6595). This is ideally suited for monitoring the expected smaller particle debris (5 microns and less) at parts-per-million quantities.

Corrosive wear debris is commonly a metal oxide, and most metal oxides are black and ultra-fine. However, sometimes reddish rust flakes can be observed. The previously described WPA techniques are appropriate for these analyses.


Fatigue wear particles

Fatigue

Fatigue wear is a consequence of subsurface cracking, which is caused by cumulative rolling contact loading of rollers, races and pitch lines of gear teeth. Fatigue is a work-hardening process during which dislocations migrate along slip planes through a metallic crystalline morphology. Eventually, the metallic hardening progresses to subsurface cracks accompanied by acoustic emissions like miniature earthquakes.

Fatigue moves from incipient cracking to interconnected cracks and finally to spall. This occurs when cracks intersect surfaces, allowing chunks and platelets to be carried away by the lubricating fluid. Further rolling contact produces more and larger chunks and platelets.

Acoustic emission or stress-wave analysis such as PeakVue is capable of detecting subsurface cracking that eventually produces fatigue wear. X-ray fluorescence spectroscopy (XRF) and ferrous density measurements are used to detect wear debris released into a lubricant.

When these particles are analyzed using WPA techniques, they typically look like irregular chunks or platelets. ASTM D7596-based approaches are also beneficial.

.

Boundary Lubrication (Adhesion)

Boundary lubrication is a lubrication regime in which loads are transferred by metal-to-metal contact. For most machine designs, this is abnormal because preferred lubrication methods provide a lubricant film between load-bearing surfaces. Inadequate lubrication results in boundary lubrication due to one of four reasons: no lubricant, low viscosity, excessive loading or slow speed (or a combination of these).

Normal lubrication under rolling contact is intended to produce elastohydrodynamic lubrication (EHD), which is found in “anti-friction bearings” where the fluid film is typically 1 to 5 microns thick between rollers and races. Normal lubrication for journal-type bearings produces hydrodynamic lubrication where fluid films are 50 to 100 microns thick.

When normal lubrication breaks down due to any of the four reasons listed previously, the load between moving surfaces is transferred by metal-to-metal contact, and friction rises to very high levels. Contact temperatures then become extremely high, producing melted, smeared and oxidized wear debris. Contact friction also generates high decibels of ultrasonic and audible noise.

Contact ultrasonic measurements or high-frequency stress-wave analysis techniques such as PeakVue are capable of detecting friction produced by boundary lubrication (metal-to-metal contact). Oil-breakdown-related techniques such as viscometry, time-resolved dielectric (ASTM D7416), AN and BN are also relevant in this case. Particulate can be quantified via ferrous and XRF techniques.

Fatigue wear particles, which can be captured using WPA techniques including ASTM D7596, typically demonstrate the effects of extreme temperature with evidence of metal-to-metal surface dragging.

Application-Specific Failure Mechanisms

In addition to the four principal mechanisms mentioned previously, four other mechanisms contribute to component failures in industrial machinery. These four modes are not as pervasive as abrasion, corrosion, fatigue and boundary wear, yet in particular applications, material deposition, surface erosion, cavitation and electrical discharge can be critically important.

Deposition

Deposition is different from the other failure modes because it involves material placement rather than material removal. While not a wear mechanism, adding foreign material that causes damage or plugs openings is another component failure mechanism.

Material deposition on machinery components can lead to serious problems. Materials likely to be deposited are typically transported by a gas or fluid to machine surfaces where they build up. Leading edges and other surfaces of fans and impellers tend to accumulate fibrous and particle debris transported in a liquid or gas that is being pumped. These accumulations lead to imbalance and reduced performance. Compartments frequently collect particle debris and sludge, making it very difficult to maintain system cleanliness during and after a surge in circulating oil. Control valves and other internal surfaces sometimes gather varnish deposits, which can severely impact their performance.

Wear Particle Atlas


For more information on wear debris analysis, check out the revised and expanded edition of theWear Particle Atlas.
This 192-page book offers information on the identification of various wear particle types, descriptions of wear modes that generate particles, consequences of these wear modes and an explanation of the techniques that facilitate wear particle analysis. To order online, visitstore.noria.com.

Vibration analysis is capable of non-intrusively identifying imbalance and other performance reductions caused by material deposition on rotor components. Infrared spectroscopy, patch colorimetry and cyclic voltammetry are useful approaches for detecting many issues associated with electro-chemical deposition mechanisms. Visual examination and periodic cleaning are advised for applications where debris accumulation is unavoidable, such as in air handlers and pumps. Patch testing can be utilized for observing many forms of particle, semi-solid and color body materials that may build up on surfaces and lead to varnish formation.

Erosion

Erosion occurs when material is removed due to particle impacts. Sand-blasting is an excellent example of erosion wear. Automobile owners in desert areas often coat their cars with an extra layer of clear polymer to protect the finish. Otherwise, paint is quickly removed, exposing bare metal on hoods and fenders.

The simplest form of condition monitoring is optically identifying a cloud of debris being forcefully propelled by fluid media into a solid surface. Visual examination is a recommended means of detecting evidence of erosion. It generally is impractical to perform wear particle analysis for wear caused by erosion because the volume of solid matter causing erosion is overwhelming.


Severe sliding wear particles

Cavitation

Cavitation wear is commonly experienced on the back side of impellers. A low-pressure vacuum creates voids or bubbles in a liquid, which collapse when pressure returns. The fluid then speeds up to fill the voids. As the fluid fills the collapsing voids, it accelerates to supersonic speeds, and shock waves cause material damage to the back side of the impeller. Damage kicks away material, leaving pits in the surface.

Acoustic emission and stress-wave analysis such as PeakVue are capable of identifying cavitation. However, debris analysis is unlikely to detect impeller damage due to cavitation. Therefore, it is recommended that impellers be visually inspected at opportune intervals to look for signs of cavitation and other evidence of physical deterioration.

Electrical Discharge

Electric motors sometimes produce shaft currents, where current travels along a length of a shaft, across a bearing fluid-film thickness and back through the machinery housing to the ground. Typically, the lubricant film boundary is approximately 1 micron thick for roller bearings and 50 microns thick for journal bearings.

Lubricants are good insulating “dielectric” fluids. Electrical discharges arc across the fluid-film gaps striking metal surfaces on both sides and creating surface damage under intense heat and shock of microscopic electrical arc blasts. In roller bearings, this process is sometimes called “fluting” due to a symmetrical pattern related to the roller positions under repeated electrical discharge.

Shaft currents can be identified electrically using a sensitive machinery analyzer or multimeter to detect current passing from the ground through a metal brush contacting the rotating shaft. Electrical discharge blasts may be recognized using acoustic emission or a stress-wave measurement technique such as PeakVue.

Electrical discharge particles are typically ejected as molten metal, which solidifies into spherical “welding slag” with a black, partially oxidized surface. Unlike welding slag, which usually is 50 to 100 microns in size, these particles can be relatively small.

Combining Vibration and Oil Analysis

To effectively monitor rotating machinery at industrial plants, it is advisable to combine vibration and oil analysis techniques. Vibration analysis covers a range of proactive measurements, including resonance, looseness, misalignment, imbalance, incorrect assembly and transient operation through startup or coast down. Oil analysis is uniquely suited for proactive measurements such as the testing of incoming lubricants, contamination control, measuring water and dust in oil, and determining when oil is deteriorated or unfit for use.

Together, oil analysis and vibration analysis provide complementary predictive assessments for machine wear and the state of component failure along a progression from incipient to near catastrophic.

A Tactical Approach for Improvement

Article extract from ReliablePlant newsletter:
http://www.reliableplant.com/Read/29094/tactical-improvement-approach

When planning your continuous improvement (CI) efforts, you must first determine what it is that you are going to improve. There are always thousands of things you need to do but only enough resources to really go after a few of them. So which ones do you go after? Which ones will impact your business the most? Which ones will impact the customers the most? Which ones will help you be more profitable?

My recommendation is to start with your customers. There are several ways of obtaining input from the customer. I don’t want to get into how to collect information in this article, as that would be fodder for a whole different series of articles. However, if you don’t currently have a mechanism, try this approach: Pick three to seven of your biggest and most influential customers and call them or invite them to visit you.

Ask them these questions or other questions like these:
  1. How can we serve you better?
  2. What do we do in our process/product that causes you issues, challenges and problems?
  3. What would make us your No. 1 preferred vendor of choice?
Be prepared for price and cost to come up and be a part of the discussion. You will have to choose how to respond to this question, and you and your team need to be ready.

Next, talk with some of the internal managers and leadership. Check with accounting to see if there are things on which you should focus. Sometimes the trends can hide the details. Maybe there is an uptick in one area but a downward trend in another area. In this case the bottom line doesn’t change much, so you probably should look into what is driving the numbers up and down. Other places to look include vendors and purchasing, quality, distribution and warehousing, and sales.

Finally, talk with internal team members, informal leaders and managers. There is a wealth of information in every organization if you only take time to ask the questions and listen to the answers. Ask the internal members:
  • What issues do they struggle with?
  • What makes their jobs hard?
  • What should you improve?
  • What would make them happier to come to work?
  • How could you make their particular process more efficient?
Hopefully, you get the idea that you need to sort through and seek out input from several perspectives. The more places you look, the more comprehensive (and meaningful) the list will be. Remember, the driving force behind this is to develop a three-, six-, nine- or 12-month CI plan. Maybe this is an annual planning session to develop the Lean Six Sigma plan for the year.

The point is that you are developing your plan for improving the business in several key areas. This is a serious effort that will to some degree determine where you will spend your time, effort and resources.

Now that you have a plan, or at least a framework for the plan, you must line up the resources necessary to drive that plan and ensure that you will be successful. You need to get the right people around the table to ensure that you have buy-in and that the leadership team is going to support the plan with resources, support, time and attention.

Hopefully, since you have asked them what it is that they want you to accomplish, you have developed a plan that these folks will support. This is called alignment. Alignment means that the team in a company, division or plant agrees to support the plan and the initiatives, both tactically speaking and strategically. If you have been diligent in reaching out to people and ensuring that their thoughts, ideas and issues are represented, you should have fantastic alignment. If not, you probably have a plan with very little support.

As you are talking with different factions of the organization, you should be looking for overlap or multiple people talking about the same issue. In other words, you may hear the same issue from several different perspectives. For example, you might overhear the accountant talking about how much inventory is being carried and the manufacturing manager talking about running out of space. This is probably the same problem from two different directions.

The solution(s) to this problem will most likely solve two problems, but it will also be a large problem to tackle. The places where you have the most overlap are where you will have the most alignment and the largest potential for success.

Also, realize that while you hear about a problem, you will have to study and understand the baseline of the situation. Where do you stand now? What is the situation at present day, and what has the trend done over the trailing 12 months?

Once you have the plan and the people sitting around the table talking about the plan, look around the room and ask them: “Will you support this plan and help drive the success of this effort?” Until you get a “yes” from each stakeholder, the meeting isn’t done and you are still in the planning phase of the plan, do, check, act (PDCA) cycle.

In summary, you must have a comprehensive plan for your CI effort. Reach out to stakeholders (both internal and external to the organization) to gain buy-in, alignment and ownership. Articulate what it is you are trying to accomplish in SMART (specific, measurable, attainable, realistic and timely) terms. You then will have specific targets that should yield significant impact to your business.

Hopefully, you have some high-level goals and objectives, such as:
  • Reduce overall cost by 7 percent
  • Improve output by 9 percent
  • Reduce lead time by 14 percent
  • Reduce lost-time accidents by 7 percent
  • Improve quality (measured by first-pass yield) by 9 percent
  • Improve on-time delivery to John’s House of Widgets by 11 percent
  • Reduce inventory on-hand by 10 percent
  • Reduce cost of manufacture by 4.5 percent
The next question is how are you going to implement the plan? What should you do next? Where do you start? The first step is to see where you are currently. You may have heard the phrase “baseline.” Where are you today specifically with the data?

Next, you are going to enter into the “do” phase of the PDCA cycle.
Some potential places to start:
  1. Value stream map
  2. Road map
  3. Scorecard (if the data is the same as the goals and objectives)
  4. Lean audit (think in terms of the principles of lean that Dr. James Womack outlined in his books)
    • Value
    • Value stream
    • Flow
    • Pull
    • Culture
This last one may be hard to put together in the short term. If you choose that route, ask around to see if you can find a lean audit that you can use without creating one.

Wednesday 28 September 2016

Communicate to Build World-Class Culture

Article extract from ReliablePlant newsletter:
http://www.reliableplant.com/Read/29089/communicate-build-culture

What is the real objective of Lean Six Sigma? When I ask this question, I usually get responses such as increased quality, improved speed, reduced cost, reduced errors and many other tactical improvement measures. Those are all benefits to continuous improvement (CI). The real goal of CI is to build a culture or improve a culture. As Dr. Womack wrote in Lean Thinking, the fifth principle of lean is culture.

So what does it mean to build a culture or to enhance the culture? How does a world-class culture behave? A world-class culture has an engrained tendency to seek out, identify and drive improvements at all levels of the organization. It moves from a culture where lean and Six Sigma are something to be done (like a project) to a place where Lean Six Sigma is simply the way things are done.

As you are engaging your CI plan, ask yourself what your culture is like. Are you doing CI or is CI simply the way things are done? This shouldn’t be hard to figure out, so don't spend a lot of time dwelling on it. Either you are or you aren't. Either answer is OK. Just recognize where you are and where you are trying to go.

Part of the equation in building a world-class culture is to engage people at all levels of the organization. Leaders must tie everyone into the plan for the CI process. They must get people involved, ask them for help and support them through the change. In short, leaders must lead them through the process. Communication is the first step to doing this.

Once you have developed your CI plan for the division, plant or department, tell people about it. Share it with those around you and those who work in the processes that will be affected. Tell them what you (with their help) are going to do. In so doing, you are absolutely obligated to two things:

  1. Tell them why you have this plan.
  2. Tell them what is in it for them.
I can’t stress these two items enough. If you are going to build a culture and truly reach where you are trying to go, you must get everyone involved and singing from the same sheet of music. You must get them onboard with the plan if they are going to support it.

Too many management teams still employ demand and direct tactics. They use pressure to get things done. While this can be effective, it usually does little to engage the culture or endear the personnel to the organization. Engage and empower your team members if you want to accelerate the velocity of the CI plan.

Another part of the communication process is to post the information on the wall, on the shop floor and wherever you have a facility board. Put the plan, targets, progress and results together in one place. As you can, have communications at that place and talk about it. People want to know how they are doing, what is coming up next and how they are involved. People want to hear about results and plans. They want leaders to point out when things are going well and when things need to be improved or changed. People want to know where they stand. It is the leaders’ job to have open and honest communications with them as much as possible.

After you communicate and post the plan, you are almost ready to start executing. Before you do, however, you also need to make sure that all of this work doesn’t become "window dressing." How are you going to communicate going forward? How are you going to share the wins, challenges and opportunities going forward? How are you going to hold yourself and your team accountable? What are you going to do to keep people fully engaged?

I am not going to tell you the answer, but I will offer some very strong advice:
  1. Communicate clearly.
  2. Communicate frequently.
  3. Communicate consistently.
  4. Communicate honestly.

As I once heard about cowboy leadership principles, "If you are leading a herd of cattle, take a look around every once in a while and make sure they are still following you."

Learning Conflict Resolution for $1

Article extract from ReliablePlant newsletter:
http://www.reliableplant.com/Read/29086/learning-conflict-resolution

In my seminars and speeches, I sometimes use audience participation to drive home a point or to interrupt the "I've heard it all before" mind-set. It is important to put what follows in the context of problem-solving or conflict resolution. An example would be with a contentious team or when discussing the issue of Band-Aiding a problem or fixing it right the first time. You have my blessing to use this exercise if you promise not to let the cat out of the bag if you are ever in my audience or class.

Begin by saying, "I am going to auction off a dollar bill. Here it is: a real greenback. There is a slight catch; the second highest bidder also has to pay me. Does everyone understand the rules? Who will start with a nickel?"

(If someone starts with a dollar, explain that some folks would like to make some money, and you would like an opening bid of a nickel or a dime.)

Once you have your nickel bid, you can proceed with: "Great, you have a bargain. Is there anyone who can bid a dime?"

At this point, I'll usually get a dime, and someone else will chip in with a quarter. If not, get into the audience and encourage people to bid higher. The more bidders, the merrier, although my experience is that it quickly becomes two bidders.

I now go back to the dime person and say, "You are now out a dime. Be the higher bidder and you are ahead." Or, I will say, "Are all of you going to let this guy have 75 cents when you could get into the process?" Someone will enter the fray. You have to keep going to the lower bidder to goad them into bidding higher. Use words like pride, loser, power, winner, make easy money, etc.

When two people are over 50 cents each, someone will make the astute observation that you are now ahead and making money. Ignore it. Keep after the bidders by asking the lower bidder, "Are you going to let the other bidder get away with you holding the bag?"

At some point, each will realize what they are doing. Most times, the bids will go over a dollar if you work them. When one finally quits, it is lesson time. (Do not collect, but give the dollar to the highest bidder.) Ask them and the audience to explain what was going on.

They are trying to reduce their losses by raising the ante, which is getting more costly for both at the same time. Is pride an element? Was your constant harassment a factor? Is winning at any cost a mind-set?

Can you relate this experience to real life? We see it every day — from not being upfront with other people and telling half-truths to making assumptions, getting our backs up against the wall, winning at any cost, not disclosing information, distrusting, looking good at someone else's expense, compromising and so on.

Seek out examples in the workplace.

To close, tell them, "Sometimes Joe will lean over to Helen and say, 'You bid a nickel, I'll bid a quarter and we'll stop bidding.'" This is a win-win situation and leads you to discussing another lesson. What the two bidders have done this time is demonstrate that it is possible to buy a dollar for less than a dollar, and all the emotional and personal baggage can be eliminated if there is direct communication between the parties with a desire to get it behind them and move on.

In most cases of conflict, it is important to revisit the facts and causes without the blame finger to gain understanding before deciding to expend ever more energy and resources trying to resolve a problem that is getting ever larger. This is why there are mediators, arbitrators, psychologists and effective leaders. Otherwise, damage control overcomes moving ahead and may be the demise of a person's career or even the existence of a corporation. An opening bid of $1 would replicate one of two parties possibly realizing they are the problem and deciding to seek a correct solution from the outset.

I have sold the dollar for as much as $3.50. The professor who introduced this to me used a $10 bill in a bar and quickly left after earning $15. Good luck. Remember, people should realize this is more than a game and should be able to see themselves and their organization in the example.

Consider Consistency When Selecting Grease

Article extract from ReliabilityPlant newsletter:
http://www.machinerylubrication.com/Read/29223/selecting-grease-consistency

When instructing Noria’s Fundamentals of Machinery Lubrication course, I usually ask my students to tell me the type of grease that they currently use at their facility and not to give me a color. Most technicians understand that color doesn’t reveal much about a grease’s properties, but they don’t always answer correctly with the base oil viscosity, thickener and consistency.

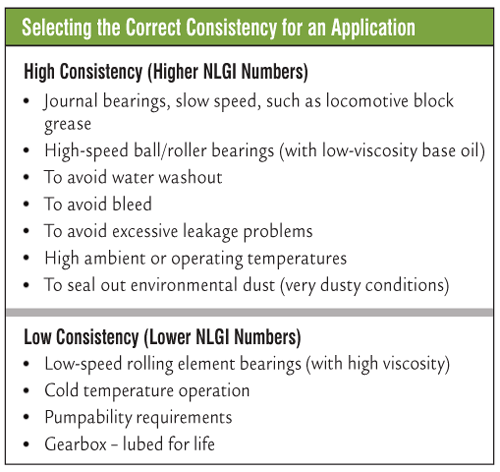
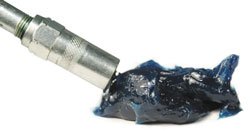
Of course, greases are formulated with oil, thickener and additives. While you may be familiar with the formulation of grease, do you know what grease consistency means and how it should influence your grease selection?


Base Oil

Grease is formulated with up to 95 percent base oil. Most greases today use mineral oil as their fluid components. These mineral oil-based greases typically provide satisfactory performance in most industrial applications. In temperature extremes (low or high), a grease that utilizes a synthetic base oil will offer better stability.

Thickener

The thickener is a material that will produce the solid to semifluid structure in combination with the selected lubricant. The primary types of thickeners used in grease are metallic soaps. These soaps include lithium, aluminum, clay, sodium and calcium. Lately, complex thickener-type greases are gaining popularity. They are being selected because of their high dropping points and excellent load-carrying abilities.

Complex greases are made by combining the conventional metallic soap with a complexing agent. The most widely used complex grease is lithium-based. These greases are made with a combination of conventional lithium soap and a low-molecular-weight organic acid as the complexing agent.

Nonsoap thickeners are also gaining in popularity for special applications, including high-temperature environments. Bentonite and silica aerogel are two examples of thickeners that do not melt at high temperatures. However, there is a misconception that even though the thickener may be able to withstand the high temperatures, the base oil will oxidize quickly at elevated temperatures, thus requiring a frequent relube interval.

Notice in the table below how much the thickener percentage affects grease consistency. Keep in mind that there is a substantial amount of oil in the grease and that field conditions can also influence grease consistency.


Cone Penetrometer

Consistency

Grease consistency depends on the type and amount of thickener used along with the viscosity of its base oil. A grease’s consistency is its ability to resist deformation by an applied force. The measure of consistency is called penetration, which is contingent on whether the consistency has been altered by handling or working.

ASTM D217 and D1403 methods are used to determine the penetration of unworked and worked greases. To measure penetration, a cone of a specific weight is allowed to sink into a grease for five seconds at a standard temperature of 25 degrees C (77 degrees F). The depth, in tenths of a millimeter, to which the cone sinks into the grease is its penetration.

A penetration of 100 would represent a solid grease, while a penetration of 450 would be semifluid. The National Lubricating Grease Institute (NLGI) has established consistency numbers or grade numbers from 000 to 6 that correspond to specified ranges of penetration numbers.

Certain conditions will affect the consistency required for a grease. The table below can help you select the correct consistency for an application.

5 Categories of Penetration

Undisturbed - Grease that is in its original container.
Unworked - A sample that has received only minimal disturbance in being transferred from the sample can to the test cup.
Worked - A grease that has been subjected to 60 double strokes in a standard grease worker. NLGI classification is based on worked penetration.
Prolonged Worked - Grease that has been worked the specified number of strokes (more than 60), brought back to 77 degrees F and then subjected to an additional 60 double strokes in the grease worker.
Block - This is the penetration of a block grease, which is hard enough to hold its shape without a container.

Additives

Additives can play several roles in a lubricating grease. These primarily include enhancing the existing desirable properties, suppressing the existing undesirable properties and imparting new properties. The most common additives are oxidation and rust inhibitors, extreme pressure, anti-wear and friction-reducing agents.

In addition to these additives, boundary lubricants such as molybdenum disulfide (moly) or graphite may be suspended in grease to reduce friction and wear without adverse chemical reactions to the metal surfaces during heavy loading and slow speeds.


It’s important to note that speed and load help determine the proper viscosity required for an application. Remember, viscosity is the most important property of a lubricant. Whenever you are selecting grease, you must also take into consideration the application and match the required consistency to ensure that you provide the equipment with the best choice to improve equipment reliability.

Thursday 22 September 2016

Foster Teamwork for Better Results

Article extract from ReliablePlant newsletter:
http://www.reliableplant.com/Read/29076/better-teamwork-results

A major mail-processing plant in Philadelphia with approximately 2,000 employees on five floors was experiencing unscheduled absences greater than 7 percent along with poor quality and high expenses. Its reputation was questionable. If you walked the plant floors, you would have trouble seeing farther than 50 feet. You would also notice deplorable restrooms (not a custodial issue), an absence of supervision, paint peeling from the walls and lots of red-tagged rolling stock on the floor. In spite of this, the maintenance department was held in high esteem as it managed to keep the equipment operating. You can imagine the magnitude of union grievances, Equal Employment Opportunity Commission (EEO) complaints and letters to the Occupational Safety and Health Administration (OSHA).

The new plant manager, Al LaRiviere, had a challenge. His first actions were to remove all red-tagged equipment as well as the equipment that was not being used. The number of items that were placed in the parking lot numbered more than 1,000. More than half were scrapped, while the others were eventually repaired at another facility. Next, he began a process-management study of what really transpired in the plant and worked to get management involved as a team.

This was a 24-hour, 365-day plant with three shifts per day. There were approximately 350 employees in the maintenance staff to manage the building’s more than 1 million square feet, customer lobbies, 20 acres of land, more than 200 pieces of automation, 2 miles of conveyor, all custodial needs and the 25 stations around the city. The original plant was a Works Progress Administration (WPA) project and had been modified numerous times.

Originating mail (mailed within the plant’s service area) and destinating mail (coming into the plant’s processing area) processes were broken into streams (letters, parcels, small items and bundles). It had an inventory turn of 365 per year (unable to store mail). Critical metrics were measured in days from the mail being placed in a box to the delivery day (delivery standards). Each type of mail had different standards. There was also a quasi-metric of work hours used versus work hours earned (budget performance). These were the results metrics on which the plant manager was rated.

An external evaluation of the management team’s competencies recommended team training, individual training, and development of all supervisors and managers on interpersonal skills and how to supervise. This was begun concurrent with the process-management study.

In the study, the performance indicators were identified as process or results. Examples of process were absence, production, unit quality and meeting work-area clearance times. The bottom line was did the mail clear the various operations having had quality sortation and did the right mail get on the correct transportation at the scheduled dispatch time. These last two questions became the plant results indicators. If they were consistently met, the plant’s delivery standards were met.

Armed with the process study results, LaRiviere made a decision that he only wanted his management teams to be concerned with two metrics — clearing the mail on time and quality of sortation. He felt that productivity was the result of the individuals’ motivation and would accompany the meeting of the indicators. These became the results indicators for each supervisor’s/superintendent’s processing areas. The shift managers had the results indicators of the right mail on the right trucks at the right time. All staff meetings or other management discussions were limited to those two sets of metrics.

LaRiviere even had a small stand with three steps built for the conference room. If a person failed his metrics, he had to climb the steps to stand up and be counted. There was no follow-up discussion. However, LaRiviere did institute celebrations for achievements (lots of them).

Training for all employees focused on the two metrics and the process within their work areas. Supervisors were not to focus on absence rates, individual performance, reasons for incoming mail quality or being critical about any other process with their employees. It was the supervisor’s responsibility to worry about upstream and downstream problems and to have his or her employees focus on their work.

Supervisors were also to develop a team. Each supervisor posted his or her team’s process indicators each day (how much was processed, work hours, internal quality and delayed mail). All machine operators were trained on using the machine-generated production reports, and rudiments of overall equipment effectiveness (OEE) were built into the software.

To make this work, plant employees were assigned to specific supervisors. All supervisors adhered to the game plan and were kept informed of overall U.S. Postal Service performance, their plant performance and their own area’s effect on performance. They were becoming respected go-to people for the craft employees.

LaRiviere believed that if employees knew that their managers were all on the same ship, where it was going and the game plan for getting there, they would find the confidence and motivation to perform and go home at night with a sense of accomplishment and pride in their plant.

Maintenance employees were trained on interpreting equipment performance reports, understanding the customer-supplier relationship with operators and relating to the operations people in a problem-solving mode to stop the blame game. Conversations between employees and their supervisor centered on processes in their work areas.

I have only touched the surface of this remarkable turnaround. Unscheduled absences dropped to 3 percent, productivity increased 20 percent and the plant’s quality led the region. Would you believe they now had too many people coming to work each day? Employees now counted on supervisors to supervise, keep them informed and buffer them. Supervisors now held their heads up and looked forward to coming to work.

LaRiviere also had the interior plant painted and put up meaningful signage to make it a visual workplace. He reduced the number and size of restrooms (original employment was more than 4,000 employees). He then worked the same process with human resources, finance, maintenance, vehicle operations and office staffs. LaRiviere was a unique manager who was at the right place at the right time.

While this is not necessarily a maintenance story, it does illustrate the use of process-management tools, the understanding of what makes people tick and what a vision can produce when the top dog is given the freedom to take a chance.

How to Determine Bearing System Life

Article extract from ReliablePlant newsletter:
http://www.machinerylubrication.com/Read/29228/bearing-system-life

When the topic of rolling bearing life arises, engineers often ask questions such as:
  • “What do you mean by rolling bearing life?”
  • “How do you know when you come to the end of bearing life?”
  • “Is it when the bearing stops rotating?”
  • “Is it when the machine within which the bearing resides reaches a specific operating time?”

Typically, answers to these questions might include: “The end of life comes when the bearing or bearings are no longer fit for their intended purpose,” or “When it stops rotating.” Unfortunately, these answers are neither specific nor adequate.

In bearing manufacturers’ catalogs and most engineering design books, the phenomenon that limits bearing longevity and reliability is termed rolling-element fatigue. This phenomenon has been studied for more than 120 years beginning in the 1890s with the pioneering work of Richard Stribeck in Germany, as well as the early part of the 20th century with John Goodman in Great Britain and Arvid Palmgren in Sweden.

Palmgren’s contributions probably were the most significant to rolling-element bearing technology. In 1924 he provided the foundation for rolling-bearing life calculation. He articulated that bearing life was not deterministic but rather distributive. He meant that no two bearings in a group run under the same conditions or will fail at the same time. He proposed the concept of an L10 life or a time at which 90 percent of a population of bearings will survive and where 10 percent have failed. He was perhaps the first person to propose a plausible approach to calculating the life of a machine element.

The source of most engineers’ practical knowledge of ball and roller bearings comes from bearing manufacturers’ catalogs. For about 90 to 95 percent of machine design applications, the equations and recommendations in the bearing manufacturers’ catalogs provide for safe and reliable design. Usually, the remaining 5 to 10 percent of the applications require specialized knowledge and analysis to avoid problems.

Failure Modes

The ultimate failure mode limiting bearing life is rolling-element fatigue of either a bearing race or a rolling element. Rolling-element fatigue is extremely variable but is statistically predictable depending on the steel type, steel processing, heat treatment, bearing manufacturing and type, lubricant used and operating conditions.


These images show representative rolling-element fatigue failure of an inner race (left)
and ball (right) from 120-millimeter-bore ball bearings made of AISI M-50 steel.

The failure manifests itself as a spall that is limited to the width of the running track and the depth of the maximum shearing stress below the contact surface. The spall can be of surface or subsurface origin. A spall originating at the surface usually begins as a crack at a surface defect or at a debris dent that propagates into a crack network to form a spall. A crack that begins at a stress riser, such as a hard inclusion below the running track in the region of the maximum shearing stress, also propagates into a crack network to form a spall.

Fatigue failures that originate below the contacting surface are referred to as classical rolling-element fatigue. Failure by classical rolling-element fatigue is analogous to death caused by old age in humans. Most bearings, however, are removed from service for other reasons.

Failures other than those caused by classical rolling-element fatigue are considered avoidable if the bearing is not overloaded and is properly designed, handled, installed and lubricated. With improved bearing manufacturing and steel processing along with advanced lubrication technology, the potential improvements in bearing life can be as much as 80 times that attainable in the late 1950s or as much as 400 times that attainable in 1940.

Basic Bearing Life

As mentioned previously, the L10 life, in millions of inner-race revolutions, is the theoretical life that 90 percent of a bearing population should equal or exceed without failure at their operating load. It is based on classical rolling-element fatigue. The “basic bearing life” often referred to in bearing manufacturers’ catalogs is the L10 life without life factors, which are dependent upon the bearing type, bearing steel, steel processing, heat treatment, lubricant and operating conditions.


These illustrations depict a subsurface-initiated spall at a hard inclusion (top) and
a surface-initiated crack network from a surface defect.

Most bearings are selected and sized based on the “basic bearing life” calculated with and, at times, without life factors. The caveat is that on or before this calculated time, 10 percent of the bearings operating under this load and speed can be expected to fail. Many engineers do not realize that the life they have calculated is based not on the time before which no failures will occur but on the time before which 10 percent of the bearings can be expected to fail. This mistake can result in warranty and product liability claims for the equipment manufacturer.

Bearing System Life

Since it can be assumed with reasonable certainty that any rotating machinery will have two or more bearings comprising the system, you must also determine the bearing system life in addition to individual bearing life. This can be achieved by combining the individual bearing lives into a single life for the system.


To establish system life, an understanding of strict series reliability is required. Remember, the life of the bearings as a system is always equal to or less than the life of the shortest lived bearing in the system. For example, say you have a simple speed-reducer gearbox with two bearings supporting the input gear running at 3,600 rpm and an output gear supported by the same two types of bearings running at 900 rpm. At full (100-percent) load or torque, the lives of each of the input bearings are 2,500 hours, and the lives of each of the output bearings are 10,000 hours. The 10-percent life of the system would be calculated to be 1,124 hours. This means if you distributed 1,000 gearboxes and they were all operated at maximum torque for 1,124 hours, 100 gearboxes would have at least one bearing failure. The question then becomes how long could you operate the gearbox at this condition without a failure.

If the life of the shortest lived bearing in the system is 2,500 hours, it can be reasonably expected that for the first 133 hours of operation for each gearbox there will be no bearing failure. However, the gearboxes may not be operated at full output torque at all times. Assume that the gearboxes operate at full torque for 50 percent of the time, one-half torque for 30 percent of the time and one-quarter torque for 20 percent of the time. In order to calculate the total system life, you would need to calculate the L10 system life at each condition.

At an L10 system life equal to 2,671 hours, 10 percent of all the gearboxes in service would theoretically have one or more failed bearings. If, as in the previous example, you have 1,000 gearboxes in service and have 100 failed gearboxes, you would have 100 failed bearings out of the 4,000 bearings in service. In other words, 2.5 percent of the bearings in service that have failed account for 10 percent of the failed gearboxes. The other 97.5 percent of the bearings in service can reasonably be assumed to be undamaged and usable.

This is why the vast majority of undamaged bearings removed from service have never reached their calculated L10 life. Therefore, it becomes practical and cost-effective to inspect, rework and place back into service those undamaged bearings that were removed before reaching their L10 life.

Causes for Removal

So far this discussion has been based on classical rolling-element fatigue as the sole mode of failure and bearing removal. However, probably less than 5 percent of bearings are removed from service because of rolling-element fatigue, whether of subsurface or surface origin.

Table 1 features a list of probable causes for bearing removal and an estimated percentage related to each respective cause. In addition to this list of causes for bearing removal, related failure modes categorized under “other” would include bearing misalignment, true and false brinelling, excessive thrust/bearing overload, lubrication, heat and thermal preload, roller edge stress, cage fracture, element or ring fracture, skidding damage, and electric arc discharge.

These causes for bearing removal and failure can be minimized and/or mitigated by good bearing design, proper bearing installation, timely maintenance and good lubrication practices. However, they cannot be eliminated entirely, which makes understanding and determining bearing life even more important.

Create, Implement Improvements Daily

Article extract from ReliablePlant newsletter:
http://www.reliableplant.com/Read/29079/implement-improvements-daily

I heard a radio interview some time back with Neil Sedaka. If the name is no longer familiar, he is probably one of the most successful songwriters of all time. His songs (more than 1,000 of them) are performed by many different and famous artists. How does he write? Every morning he gets up, has breakfast, sits down at the piano, and just writes and rewrites music all day long.

Shelby Foote is probably the most widely read historian of the U.S. Civil War. Every single day, he got up in the morning and wrote 600 words, and he wrote them long hand with a nib pen and inkwell. He found that speed worked best for his flow of thought. If for some reason he missed a few days, he found it very difficult to get back to his 600-word pace, so he seldom missed a day.

When Michelangelo painted the Sistine Chapel ceiling, he didn't just whip it out in a few months. He spent four years, just about every single day, lying on his back on scaffolding, dripping paint on his face, painting and repainting, and then repainting.

Samuel Taylor Coleridge supposedly told that he wrote of the fabulous images in the poem Kubla Khan immediately on waking from a drug-induced dream, when actually it was rewritten as many as 14 times.

So it is with improvements.

Generating and implementing improvements is just plain everyday work by everyone. We have a vision of creativity — sudden revelation, inspiration out of the blue, ideas by gifted individuals – but if we wait for this kind of process to generate improvements, there won't be many.

It's like counting on the probability percentage of being struck by lightning. It's not high (unless you are a golfer). However, the probability of being struck by lightning is higher than the probability of winning a state lottery, even if you do buy a ticket.

Every single day or shift, as issues develop and are dealt with, the discussion and analysis of these issues should generate improvements. The synergy of the properly conducted daily shift overlap meeting will continuously generate improvement ideas, and more importantly, provide the involvement and ownership that actually gets these ideas successfully implemented.

The improvement may not completely resolve the issue, but if it makes a contribution, that’s just fine. The next one will take it further. Many improvements simply have to do with generating communication and training material. The material doesn't have to be perfect to be shared. The key thing is that it's shared quickly while the issue is current. This enables other ideas to be built on it, which will lead to even more improvement.

We do tend to fixate on equipment and material modification and upgrades when looking for improvements, but the majority of opportunities and the easiest to implement are about how people do work.


About the Author
Currently working as a consultant, John Crossan retired after spending 30-plus years with the Clorox Company. His roles for much of the past 14 years were mainly focused on improving operations by ... 

Develop a Plan to Reach Continuous Improvement Goals

Article extract from ReliablePlant newsletter:

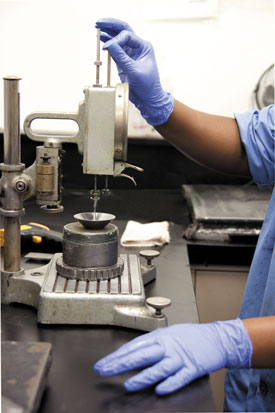
In the ever-changing world of continuous improvement, we must always remember to walk our own walk. If we, as continuous improvement leaders, are teaching and coaching people in the plan-do-check-act (PDCA) process, we too must ensure that we are leading by example. We must not vary our process from this cycle of improvement that works so very well.

Too many companies get so focused on the DCA part of the equation that planning is completely left out or is at best an afterthought. We do, check, act, do, check, act over and over again so many times that we are working really hard in several different directions.

Instead, I challenge you to be very deliberate in your planning process. Since I am focused on continuous improvement, I am writing this note from that perspective.

What exactly do you want to accomplish through the application of continuous improvement? While that is a pretty broad subject, consider each of the following topics: quality, cost, delivery, safety, morale and growth. Thinking as specific as you can, lay out quantifiable goals for each of these topics so that the organization has a clear signpost to follow, as well as a quantifiable progress report for the fiscal year you are confronting.

Most of this is clear if you go through an enterprise-level value stream map. If that is not the model you follow, at least spend time with the continuous improvement process to define where you are trying to take the organization.

Once you have determined your high-level goals for each of these topics, then you can set out with the tactical plan for how to accomplish those goals using Pareto analysis, value stream maps and other tools. The point is to define where you want to go before you embark on the trip.

As someone once told me, "If you don't know where you are trying to go, the best map in the world won't help you much."

Microdieseling and Its Effects on Oil

Article extract from ReliablePlant newsletter:
http://www.machinerylubrication.com/Read/29220/microdieseling-oil-effects

Would you consider 2,000 degrees F to be hot? At this temperature, aluminum, copper, gold and iron have already melted; stainless and carbon steels are glowing red; and your Thanksgiving turkey would turn into a charred mess in less than a second. So what is so significant about 2,000 degrees? Did you know that many hydraulic systems can create temperatures in this range?

Have you ever walked by a hydraulic pump that was cavitating? Once you hear it, you will never forget the signature sound it makes. I describe it as a can of marbles being shaken. What is actually happening is that the pressure acting on the fluid is below the saturation pressure of the dissolved gas (normally air) in the fluid. If the gas bubbles pass through a higher pressure zone (like that found on the discharge side of the pump), they will violently collapse. This alone can cause serious reliability issues with the machine component in terms of vibration, noise, surface damage and potentially failure.

37%of lubrication professionals have seen the effects of microdieseling, based on a recent survey at machinerylubrication.com

The compression of these bubbles in that pressurized side of the pump is adiabatic (not much heat is exchanged between the fluid and the bubble during the nanoseconds of increasing pressure).

For example, consider a hydraulic system with a suction-side air leak that lets in bubbles at a little less than atmospheric pressure and 100 degrees F and then pressurizes the fluid to 1,800 pounds per square inch (psi). The temperature in this example, which is typical of a hydraulic system with an air leak, would be just more than 2,000 degrees F.


When an air-ignitable mixture is present inside the bubble, ignition is almost inevitable at these incredible temperatures. This is the process known as microdieseling. It will lead to the oxidative degradation of the oil, higher operating temperatures, pressure spikes and the cavitational erosion of the hydraulic pump and other components.

The sources of the bubble formation within the system include but are not limited to:

  • Pressure drop through an orifice
  • Pressure drop through pipes and hoses
  • Turbulence from valves opening and closing
  • Shock waves due to sudden closing of valves and cessation of pump operation
  • Pressure drop due to the sudden opening of a valve
  • External force on a piston rod
  • Suction resistance
  • Plunging of fluid at the return to the tank
  • Inadequate net positive suction head available (NPSHA) relative to the net positive suction head required (NPSHR) in centrifugal pumps
  • Suction-side recirculation to sub-best efficiency point (BEP) operation of centrifugal pumps
  • Nearly dry operation of a pump due to insufficient fluid volume

Problems that result from the formation or presence of these bubbles include:
  • Oil temperature rise
  • Deterioration of oil quality
  • Degradation of lubrication due to viscosity loss or sludge and varnish formation
  • Reduced thermal conductivity
  • Cavitation and erosion
  • Noise generation
  • Reduced bulk modulus due to fluid aeration, leading to a spongy fluid and sluggish system control
  • Decreased pump efficiency
  • Reduced dielectric properties

    4 States of Air-in-Oil Contamination

    Dissolved Air - Air is completely dissolved in the oil and cannot be seen (no clouding).
    Entrained Air - Unstable microscopic air bubbles in oil.
    Free Air - Trapped pockets of air in dead zones, high regions and standpipes.
    Foam - Highly aerated tank and sump fluid surfaces (more than 30 percent air).

In layman’s terms, microdieseling is a pressure-induced thermal degradation. An air bubble will transition from a low or negative pressure area to a high-pressure zone and through adiabatic compression get heated to very high temperatures. These temperatures are high enough to carbonize oil at the bubble interface, resulting in carbon byproducts (sludge and varnish) as well as increased oil degradation (oxidation). In the best-case scenario, you would be able to stop the root cause of the problem - the bubbles. If you can control the bubble population, you can control microdieseling.


About the Author
Jeremy Wright
Jeremy Wright is a Senior Technical Consultant for Noria Corporation. Hire Jeremy to develop procedures for your lubrication program or to train your team on machinery lubrication best practices. ...