Showing posts with label Oil Cleanliness. Show all posts

Thursday, 20 October 2016

Best Strategies for Managing Varnish

Article extract from ReliablePlant newsletter:
http://www.machinerylubrication.com/Read/29354/managing-varnish-strategies

Varnish is the product of a chemical reaction within oil which leads to a new chemistry being created that is different from both the oil and its additives. A prevalent varnish begins as an acid, which is typically caused by a reaction of the oil’s additives as they become consumed or the base oil’s chemistry as it is degrading. It may also result from a reaction of the oil with other chemistries, which may be present as contaminants within the oil or the system. As with other lubricant-related properties or associated machine conditions, condition-monitoring techniques can be used to assess the accumulation of varnish within oil and manage the detrimental effects that follow.

Condition Monitoring

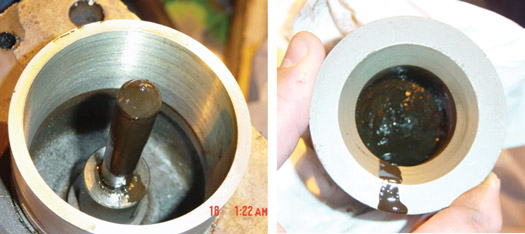
Lubricant condition monitoring involves obtaining data that supports an evaluation of the acceptability of the machine performance and the viability of the oil. To date, deposits on lubricated equipment have been the focus with regards to the detrimental effects of varnish. Figure 1 shows examples of bearings with significant varnish accumulation.

In general, the alarm and action criteria used within industry are set at levels to avoid power loss or machinery damage but may not include the prevention of varnish deposits. This discounts the effect varnish has on the design and performance of the oil and may allow oil to remain in service when it has exceeded failure criteria.

A principal area of lubricant condition monitoring that can often be overlooked is the suitability for continued use of the oil. This type of monitoring determines if the oil is able to meet its design properties. When outside of these criteria, the oil can be considered to be in a failure mode. Unfortunately, this aspect of lubricant condition monitoring appears to have become lost in comparison to the significant machinery impacts seen when varnish is found in turbine systems.


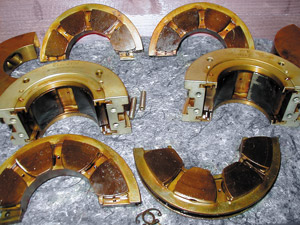
Figure 1. These heavy varnish deposits
were found on bearing surfaces.
(Courtesy Fluitec International)

If oil condition was the focus of monitoring rather than machine condition, then varnish likely would not progress to the point of accumulation and the oil would be much more capable of meeting its design. This type of lubricant condition monitoring should be emphasized when performing varnish-related monitoring since oil with a high varnish load can be expected to have critical loss in key design characteristics such as water separability and inhibiting corrosion/rust, foam and air release. Loss of any of these properties can place the system at significant risk. Testing criteria that focus on these properties should be at the forefront of the varnish issue.

Varnish Basics

The typical varnish progression begins with a reaction at the molecular level. This generally includes an oxygen molecule. In oil, the oxidized molecule is controlled through additives, which inhibit it from accelerating the degradation of the remaining oil. As more varnish forms, it becomes distinct particles that can be measured in nanometer-sized particles. As the numbers of these particles increase, this degradation material within the oil can be described as a varnish cloud of nanometer-sized material. When the cloud density oversaturates the oil, some of the varnish material will settle out within the lubrication system (like rain falling from the sky) in the form of a deposit. In time, the deposit can harden into a solid material, which is commonly known as varnish.

Oil Saturation

Turbine oil is designed to hold and manage a finite volume of varnish material. When this capacity is exceeded, the oil is considered saturated. Deposits can then form and accumulate in the system. Saturation has a relationship with temperature in that oil at a higher temperature is able to retain a greater volume of the nanometer-sized varnish material than oil at a lower temperature.


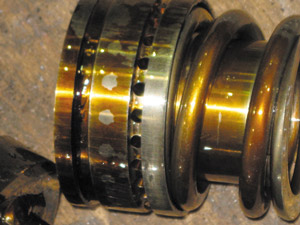
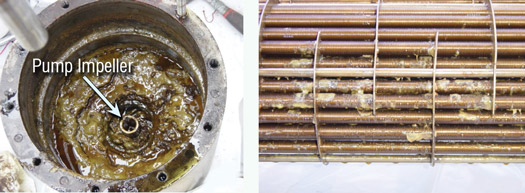
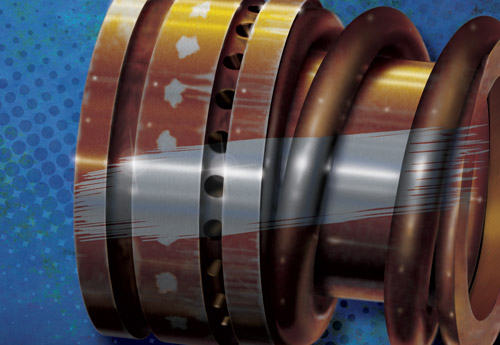
Figure 2. Varnish can occur in any system.
(Courtesy Paul Sly, Chevron)
The desired system condition for new oil would be to install the oil into a clean system so the progression of oil degradation and subsequent varnish accumulation would be limited to natural degradation of the oil. This degradation progression should be limited to the influences of new varnish created within the system as opposed to existing system varnish, which is known to accelerate oil oxidation.

It is important to install oil into a clean system so the maintenance sensitivity will more appropriately respond to the oil’s initial varnish saturation level as an oil failure criterion. This sensitivity should be maintained at the lowest expected system oil temperature rather than at a higher temperature, since deposits will form and collect in a system at this lower temperature, and deposit formation should be considered a lubricant failure mode.

Base Oil Influence

Varnish accumulation is also influenced by the base oil category, as designated by the American Petroleum Institute (API). Group II base oils have a superior design and can be expected to provide improved performance over Group I base oils, assuming that the system in which the oil is installed is clean. Both Group I and II base oils have inherent solvency, which means that they have a finite capacity to accumulate and hold varnish products. However, there is an important difference in how each does this. Due to the manufacturing process resulting in a more highly saturated molecule, Group II oils have less varnish-retention capacity than Group I oils. As such, Group II oils allow varnish deposits within a system to occur with a lower overall volume of the material present.

System Cleanliness

When a new charge of turbine oil is installed, it is vital that the system be clean and free of varnish. A common problem is that many existing systems are not cleaned prior to the installation of new/replacement oil. As mentioned previously, turbine oil has a natural design property that allows it to hold and accumulate varnish. In addition, existing system sludge and varnish that have adhered to surfaces within a turbine oil system are not readily dislodged with a system flush. As a result, when new, clean oil encounters this existing varnish within a system, it begins to chemically react with the varnish and remove this material from the walls, causing the new oil to approach a point of saturation.


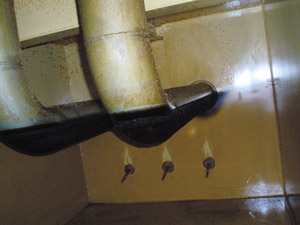
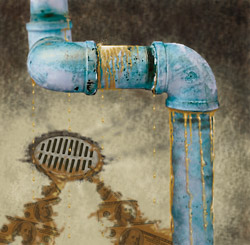
Figure 3. Varnish deposits were
found within this system.
Within a relatively short period of time, this “chemical cleaning” phenomenon can render the benefits of a new oil change moot in terms of oil performance and design. In other words, the removal of system varnish may reduce the new oil to a “failed oil” status not long after it is placed in service.

The same condition occurs after a varnish-saturated oil is cleaned of varnish residue, but the cleaning is stopped prior to the system itself becoming clean. The newly cleaned oil will again accumulate varnish materials from the system to once again approach saturation levels. Remember, varnish acts as a catalyst to speed oil and additive degradation. As such, operating with varnish within the oil allows new varnish to form more quickly and shortens the service life of the oil.

Complications/Variations

The consequences of accumulated varnish within a turbine system can include power de-rating and damage to the operating equipment. When observed problems begin to occur, the concentration of varnish within the oil or system can vary greatly. Factors such as system design, variations in the system operating temperature and fluctuations in the system operating conditions all affect varnish formation.

Systems that use turbine oil as control oil are highly susceptible to issues. The control systems include tight orifices located in lower temperature regions. These conditions allow hot, saturated oil to accumulate deposits at these important system locations.

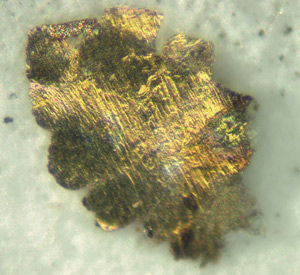
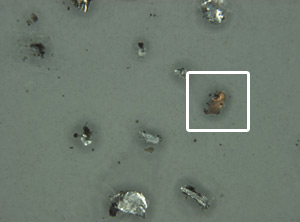
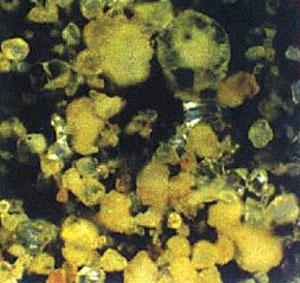
The choice of oil also impacts the rate of varnish generation and accumulation, as some oils are more prone to varnish drop-out than others. Figure 4 shows two samples with similar laboratory settling times. While these oils have a highly similar visual appearance, they have dramatically differing levels of varnish load, which is related to the influence of oil additives, base oil and the chosen formulation.


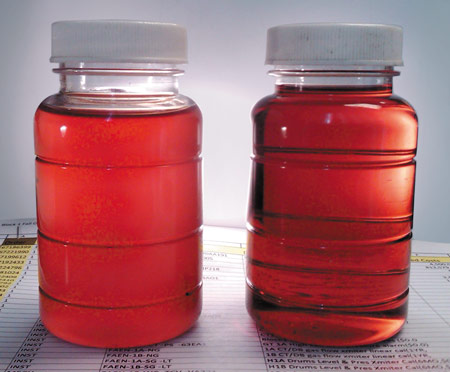
Figure 4. Different oil formulations can have very different
varnish conditions but appear highly similar.
(Courtesy Dave Wooton, Wooton Consulting)

Oils from different manufacturers are known to have different additives and base oils. Depending on the in-service operations, their differences can influence the severity of a developing varnish issue. Because these oil design variations are considered proprietary information by the lubricant manufacturers, the consumer of the oil is unlikely to be able to determine which oil formulation is least likely to cause varnish problems.

When system contaminants mix with the oil in service and further degrade it, the design properties such as water separation, foaming and the oil oxidation rate may be greatly compromised. As system design and operating conditions also vary, their impact should be considered as it relates to the select formula as well. This parameter of additive chemistry adds to existing varnish challenges for both oil performance and service life.

Laboratory Testing

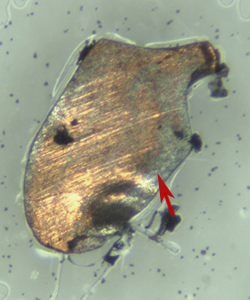
The lubricant condition-monitoring community has developed a laboratory test (ASTM D7843) to assess the degree of accumulated varnish load within in-service oil. This Membrane Patch Colorimetry (MPC) test measures the overall load of varnish type material in the oil sample and includes a three-day settling period to allow varnish material to agglomerate within the oil, which is cooling from its operating temperature.

The oil is then filtered through a 0.45-micron cellulose patch with the aid of a solvent. Varnish material collects and deposits on the patch. The patch is checked for color, which is influenced by the volume of material deposited. A dark brown color is visible when more varnish from the fluid is on the patch surface.


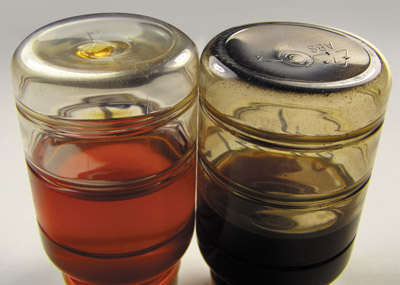
Figure 5. The MPC test measurement of the sample on the
left was 24, while the sample on the right measured 156.
(Courtesy Dave Wooton, Wooton Counsulting)

Figure 5 shows side-by-side examples of a split sample of turbine oil that was allowed to sit for a two-week settling time under controlled conditions. The sample on the left was stored in the dark, while the sample on the right was left in the sun. The contribution of the sun is the difference in these samples, which have different colors and very different varnish loads.

Alarm Limits and Criteria

The lubricant test community is currently using various versions of the color patch test to assess the volume of varnish within oil and the likelihood of damaging deposits occurring. Unfortunately, the test variations in use may scale the color differently and provide differing warning and alarm limits. These differences can lead to significant confusion in the marketplace.

In addition, current alarm limits and action criteria focus on the effect of varnish accumulation on lubricated machinery. This approach discounts the impact of varnish on the design and function of the oil as well as the potential effect of this material on other oil failure modes.

3days of settling is included in a Membrane Patch Colorimetry (MPC) test to allow varnish material to agglomerate within the oil, which is cooling from its operating temperature.

A more fundamental approach to setting alarm and action limits that includes the impact of varnish on the oil’s performance is needed. The criteria should consider when the oil has lost its design performance, and these performance failure modes should be the point of initial action.

A temperature limit of oil saturation could become an important criterion. This could be measured by the patch test but at lower limits than those presently used in order to avoid machinery issues. This approach could then retain the present criteria as a higher severity warning for varnish and separate criteria for its potential challenge to machine operation.

Mitigation

Since oil that is in operation at a fully saturated level can be expected to leave varnish deposits, mitigation strategies to manage this condition should be directed at keeping varnish levels at a concentration where deposits would not be expected to form. The following are viable preventive maintenance strategies that have been demonstrated to benefit the system oil condition or varnish saturation level:

Partial or Full Oil Changes

As new oil does not have any retained varnish products, it would not be expected to cause new deposits when added to the system. However, the benefit of this method is severely limited by the quantity of varnish deposits within the system. When new (or newly cleaned) oil is placed in service, its inherent design results in cleaning the existing system varnish, which then goes into the oil. After this has occurred, the oil can again become saturated, and new varnish deposits can commence once saturation levels have been reached.

A secondary problem can develop from this mitigation strategy if varnish is removed from a less harmful area and then re-deposited in more undesirable locations. Another drawback in making frequent oil additions including full oil replacement involves the expense, as large volumes of oil can be costly.

While this approach could be beneficial if implemented in a manner that keeps the oil in a less than saturated condition, managing this would require frequent laboratory tests to ensure the oil condition. It is also questionable whether oil consumers would be sufficiently sensitive to the rate of varnish accumulation or change in the new oil to properly implement this method. However, it would produce a net benefit if performed periodically, as the cleanliness of the system in terms of existing varnish deposits can be improved with time.

Filtration with Cellulose Media

The best time to filter varnish material retained within oil is when the oil is at an ambient temperature for a few days. This allows the varnish to agglomerate and be collected by the filter material. Filter replacement is a must if this strategy is employed, as varnish material removed from the oil at ambient temperature returns to solution if the filter is not replaced prior to returning the oil to the higher operating temperature. This is due to the greater solvency of the oil at the higher operating temperature.

The primary limitation of this approach is that the filtration is limited to the reservoir oil and cannot be expected to reduce the volume of varnish within the main turbine system. When the oil returns to service, its inherent design is as a solvent, thus the results are removal of system varnish. Once again, due to existing system deposits, a saturation of the operating oil can reoccur.

In addition, varnish can migrate from a less harmful area to an undesirable location. The overall cost of this strategy can also be expensive, as frequent filter replacements could be required to remove system varnish from the varnish-laden filters. However, this method does produce a net benefit when performed periodically, and the cleanliness of the system in terms of varnish deposits can be improved.

System Chemical Cleaning

This method is the quickest way to improve system cleanliness and allow the oil to function as it was designed. While a clean system will extend the useful service of the new replacement oil, it cannot be expected to prevent reoccurrence of varnish. Its cost to implement can also be high.

Ion Filtration

With ion filtration, oil is processed through resin beads, which chemically attract the varnish component and remove it from the oil. This cleaning can occur at operating temperature. Ion filtration takes advantage of the oil’s design to slowly clean and remove existing varnish from the system as the oil is in service. With time, this process produces both a clean system and clean oil.

Conclusion

Mitigation strategies of ambient temperature filtration followed by filter replacement or installation of new oils can be used to manage varnish in systems if carefully employed. Of course, these strategies will carry the cost of additional oil and filter purchases. Regular laboratory testing also would be needed to manage these strategies and to monitor their effectiveness.

The introduction of Group II base oils as a fundamental component of turbine oils has not caused the varnish issues that plants are currently encountering, although their solvency and capacity to hold varnish were contributing factors. The change to a Group II base oil component has reduced the capacity of the fluid to retain varnish materials. Additional contributors include the formulation of the oil, the system design, the operating conditions and how much existing varnish is within the system.

81%of lubrication professionals have experienced problems caused by oil degradation products such as varnish and oxidation, according to a recent poll at machinerylubrication.com

A primary culprit of varnish problems occurring within industry can be directly attributed to the system cleanliness in terms of residual varnish deposits. The key to long-term varnish mitigation is in establishing a system free of varnish and then continuing a process that maintains both the oil and system in this condition. Ion filtration has been demonstrated to create these conditions, although once the system is clean, frequent oil additions or filter replacements may also be useful.

While the current industry focus regarding varnish has been on turbines, the same base oils and formulations are used for compressor, circulating and large motor/gearcase applications. Likewise, the same degradation mechanisms of the oil and additives would be present with subsequent varnish accumulations expected to occur. Such varnish deposits may be found on bearing and gear surfaces as well. Although the consequences of this accumulation and stress on oil properties have not been discussed, sensitivity to varnish should also be applied to these applications.

Alarm and action limits should be established to ensure system and oil cleanliness. This approach is challenged by long-standing plant operating expectations and experiences where varnish sensitivity was not required. The existing belief that there is an acceptable quantity of varnish within either the oil or system and that it is of no consequence must be overcome. Low action and alarm criteria should be set to protect the design and performance of the oil. In other words, a no-tolerance approach to varnish is required.

Monday, 17 October 2016

Oil Leakage: How Much of Your Profit is Going Down the Drain?

Article extract from ReliablePlant newsletter:
http://www.machinerylubrication.com/Read/29347/oil-leakage-drain

When it comes to oil leakage, at what point would you say enough is enough - 10 gallons, 100 gallons or 1,000 gallons? I recently started a lubrication process design where the client hadn’t reached the breaking point and was at 56,000 gallons of oil being lost per year due to leakage. When I explained it in terms of dollars lost (literally going down the drain), everyone’s ears perked up. It was a staggering sum. They had become complacent. It started as a small amount and grew week after week until they now have to bring in totes daily to set next to the trouble actors so they can feed them like an addict needing more and more.

As with every article I write, I like to consult the massive amount of material that is kept on subjects in Noria’s library. Thumbing through the files designated “leakage” could have consumed days on end. I found folder after folder of material dating back well more than half a century. I decided to read one of the oldest I could find, and it read as if it were written yesterday. Why do these problems still persist today? There have been great advancements in fittings, hoses, seals, etc., yet just last week I found myself almost wading through the basement of a steel mill.

While touring various plants, I am always amazed at how complacent they can become to leaks. I’m not sure they even realize the effects these leaks are having on their equipment, the environment and the morale and safety of the employees.

Possible Causes of a Leak

The following list does not include all of the possible root causes of a failure, but it does encompass the majority of the top contributors.

Improper assembly
  • There are multiple fittings on the market today. Making sure the fittings match is critical to their function
  • Over-tightening can lead to structural damage of the fittings.
  • Under-tightening will result in improper sealing.
  • Hoses that are too long or in a hazardous environment have a higher likelihood of being damaged.

Poor maintenance practices

  • Improper or lack of cleanliness while reassembling components
  • Becoming complacent with inspections or routine cleaning functions
  • Not fixing the source of the leak because it is easier to just top-up the sump

Adverse operating conditions

  • Large temperature swings can cause fittings to loosen over time.
  • Process waste and debris can eventually contribute to leakage.
  • High levels of particulate ingression can promote leakage.
  • Natural weather elements and sunlight can degrade seals.

Contamination

  • Contamination causes premature degradation of surfaces and seals.
  • An external leak not only will allow lubricant to exit the system but may also allow contaminants to enter.

Vibration

  • Excessive vibration can cause fittings and hoses to become loose and experience premature wear.
  • Hose abrasion is one of the most common causes of hose failure.

Loss of production, poor machine performance, environmental hazards, safety risks and high consumption costs all result from leakage and should be very important to the operation of any plant, yet I usually choose to investigate only one of these factors, as it is the one that seems to garner the most attention - cost. Keep in mind that the money saved from a fixed oil leak goes directly to the bottom line.

Inevitably, when discussing cost, the client wants to do a simple calculation based on the number of drops per second or minute vs. the cost of the oil. I will let them run through the calculation and arrive at a value. After we ponder the loss for a second, I will then ask, “What about the labor?” Don’t forget the benefits, management, planning, paperwork, etc. That’s not all. Used oil disposal, new oil testing, safety costs, cleanup, purchasing ... I could go on and on.


So while the number calculated at the beginning was already a jaw-dropping number, it didn’t include any of these other forgotten associated costs. The next statement from their mouth is typically, “What do we do?”

I prefer to take a preventive approach. First, develop a strategic plan that is both proactive and preventive. One of the easiest ways is to perform regular inspections with associated action items that are dependent upon the results of the inspections.

The second step is to control the operational conditions as best as possible. This is fundamental to any reliability and lubrication program, but simply keeping the machines and fluid clean, cool and dry will help mitigate the leakage.

Next, implement a detection and control program. Some popular leakage-detection techniques include visual inspections, dye injections/black light, system pressure decay, pressure differential, ultrasonics and flow meters.

66%of lubrication professionals use visual inspections to detect oil leakage at their plant, according to a recent survey at machinerylubrication.com

Finally, you must exercise proper contamination control. This not only will help with leaks but also will offer huge improvements in machine reliability.

It is estimated that more than 100 million gallons of fluid leak from machines every year in North America. How much are you contributing to this number? At nearly every plant I’ve visited recently, I can calculate enough money lost to employ an entire team of technicians whose sole purpose is to identify and stop leaks. Down the drain are going hundreds of thousands of dollars that could have been added directly to the bottom line. So the next time you walk by that small puddle on the floor or that drip from a fitting, I want you to see dollar signs.

.

About the Author
Jeremy Wright
Jeremy Wright is a Senior Technical Consultant for Noria Corporation. Hire Jeremy to develop procedures for your lubrication program or to train your team on machinery lubrication best practices. ... 

Tuesday, 30 August 2016

How Particle Ingression Impacts Equipment Reliability

Article extract from ReliablePlant newsletter:
http://www.machinerylubrication.com/Read/29120/particle-ingression-reliability

Ingression can be defined as a going in or entering, a right or permission to enter, or a means or place of entering. If you have attended one of Noria’s Fundamentals of Machinery Lubrication courses, I’m sure you understand the importance of reducing, minimizing and eliminating particle ingression. Because of the negative impact particle ingression has on equipment reliability, it is critical to recognize the effects, how particles enter equipment and what you can do to reduce or eliminate ingression.

Particle ingression leads to contact fatigue, spalling, pitting, brinelling and cratering. Surface fatigue often develops from denting due to hard or soft particles. This creates a stress riser (berm). Repeated high loading (stress reversals) on berms or particles causes surface fatigue and eventually the formation of pits. This leads to larger pits followed by spalls.

85%of lubrication professionals say particle ingression has caused problems for their plant’s equipment, according to a recent survey at machinerylubrication.com

Particles can enter equipment through various means, such as through a process or a mechanical service that is performed after a failure or inspection. Therefore, it is paramount to take all precautions to minimize or eliminate any contaminants (dust, water, etc.) from coming into the equipment.


 “Six to seven percent ($795 billion*) of the gross national product is required just to repair the damage caused by mechanical wear.” - MIT Professor Ernest Rabinowicz

Most workers must deal with real-world conditions and may need to repair equipment out in the field. In these situations, take time to prep the area prior to opening an inspection door or bearing housing. This would include at the very least cleaning away debris from the inspection door or knocking off dust from overhead beams or adjacent machines.

Often it is the little things that make a big difference. Maintaining a clean area as well as clean tools and performing proper flushing of the equipment to remove any debris left behind can increase machine reliability. You have to give your equipment the best opportunity to perform its intended function, and minimizing or eliminating in-service ingression is essential to achieve this objective.

Ingression can also occur due to process conditions. This usually is the result of damaged seals or breathers and in-service equipment temperature changes, which can produce moisture within the machinery.


Faulty seals can allow contaminant ingression, which may lead to surface degradation. Machinery inspections should be performed routinely. Repairs, modifications and purchasing improved seals may be necessary to improve equipment reliability.

Keep in mind that not all seals are created equal. A proper assessment of your equipment as it pertains to temperature and the type of lubricant that you are using is crucial. Many times the lubricant and the seal may be incompatible, which can result in oil leaks. Remember, if you observe oil leaking out, there is an opportunity for contaminants to get inside the equipment.

3 Types of Particle Ingression

There are three general types of solid particle ingression: built-in, ingested and generated.

Built-in contamination consists of manufacturing debris such as burrs, machining swarf, weld spatter, abrasives, drill turnings, filings and dust. It can also include service debris that occurs when machines are opened for routine repairs and preventive maintenance.

Ingested particle ingression means that particles are coming into the machine and the lubricant under normal operating conditions (from the outside to the inside). These could be process particles (pulp, pulverized coal, ore dust, cement, clays, process chemicals, etc.), atmospheric contaminants (the result of ambient or road conditions near the machine), or combustion debris from internal combustion engines (soot, fly ash, induction air and contaminated fuel).

Generated particle ingression is when the machine makes its own particles. This can occur on internal surfaces through corrosion, mechanical wear, cavitation, exfoliation, etc. The oil also has the ability to break down and form particles (sludge, oxide insolubles, carbonization, coke, etc.).


The selection of breathers and monitoring breather condition provide another method of reducing ingression. Whether you are using them to eliminate dirt or water ingression, breathers are imperative for machine health. They must be selected according to the machinery conditions and environment. Frequently, breathers are not monitored properly. Like oil filters, they have an intended purpose and function well; however, once they reach the end of their life cycle, it is important to replace them promptly.

Remember, education is key. Understanding how ingression affects oil and equipment life is critical. Look beyond the obvious. Whether it is a color change of a breather, oil leaking from a seal, or water ingression in the oil, recognizing the effects of ingression can help you act promptly to improve machine reliability.


Tuesday, 16 August 2016

How Oil Quality Changes During Startup

Equipment manufacturers generally provide guidelines on how oil should be maintained for reliable operation. Because components have little tolerance for contamination or oxidation, frequent oil sampling and monitoring are performed while the equipment is online in order to keep the unit operating without any issues. However, many times little attention is paid to the oil quality when the equipment is shut down for a maintenance outage or on standby. This can eventually affect the unit’s reliability.

For instance, when a steam turbine is down for prolonged periods or for a short three-week maintenance outage, the consequences of not having hot, circulating oil running through the system is usually not considered. In fact, the oil quality when placing a turbine on turning gear or during startup is often not the same as when the unit came offline.


Prolonged exposure to water can
rust a control system.
Typical turbine bearings are designed for fluid-film lubrication. Most fluid-film bearings are intended for hydrodynamic lubrication. This means an oil wedge is formed in a hydrodynamic bearing to develop separation and maintain an oil film between the rotor and bearing. The film thickness is a function of rotor speed, load and oil viscosity. Under fluid-film conditions, an increase in viscosity or speed increases the oil film thickness, while an increase in load or decrease in rotor speed reduces the oil film thickness.

In developing an oil film, the bearing surface geometry and rotor surface are just as important as rotor speed, load and oil viscosity. To establish a stable oil wedge and fluid film between the surfaces, the rotor and bearing profiles must be perpendicular. If either or both surfaces become damaged by large particles being pushed through the bearing, the ability to form an oil wedge is diminished, resulting in a thinner oil film thickness. Reducing the oil film thickness increases the susceptibility of additional damage or producing a rub during coastdown or startup.


The congealed mass shown above is an example of particulate matter and
degraded oil buildup that can accumulate in a turbine control servo.
Left unattended, this condition could eventually cause poor
turbine control response and accelerate equipment wear.
When the turbine rotor is at normal operating conditions, the bearing is in hydrodynamic lubrication conditions. However, when a turbine rotor is on turning gear or beginning to roll at slower speeds, the journal bearing is in boundary lubrication conditions. These conditions are generally indicated by some metallic friction and wear.


Very high coefficients of friction may also be reached. At this point, the oil film thickness between the bearing and the turbine rotor will be at its minimum. The film thickness will increase as either the speed is increased, the lubricant viscosity is increased, the load is decreased or the geometric shapes of the journal and bearing surfaces relative to each other are improved. If the surface becomes rougher (the bearing surface becomes damaged), then the risk of rotor and bearing surface contact increases. This relationship between the surface roughness and the film thickness is important in the consideration of hydrodynamic lubrication of a turbine bearing.


 These images show the buildup of particulate in a turbine oil reservoir that is cleaned periodically. Consider the type of buildup that could occur over the life of the plant.

A major concern with rough surfaces, including gouges or grooves around the journal or along a Babbitt surface, is that they allow high-pressure lube oil to flow away from the thinnest film areas. This permits increased contact and shear forces on the Babbitt than would occur with smooth, concentric and round journals on a smoothly bored Babbitt surface bearing. This is why surfaces that appear to have minimal damage can still cause bearing failure during startup or slow-speed operation before a fully developed hydrodynamic film with a normal film thickness exists.

During a plant startup, when a turbine is on turning gear or at lower speeds, the lubrication system may supply lube oil with slugs of particulate matter to the journal and thrust bearings. This is especially damaging to journal bearings because they carry the applied load forces that force the journals into contact with the bearing surface, thus providing a very thin oil film. This form of lubrication is known as boundary lubrication. Because only a very thin oil film exists between the journal and bearing surface, and many of the particles in the oil are larger than this oil film thickness, the bearing surface can be scored as particulate becomes imbedded in the surface of the Babbitt. In some cases, the particulate can score the journal, requiring it to be remachined and/or honed.

Water Contamination

Water contamination in a lubricating or control system is particularly undesirable because it tends to form an emulsion with the oil. Elevated water content in an oil system can also affect lubricity and induce corrosion. When a lubrication or control system is shut down, the normally wetted regions, such as those in the lube oil drain pipes, become exposed to air. Enlarging the surface area of carbon steel that is subject to ambient conditions increases the amount of internal corrosion (rust) a system develops.

While a unit is operating, the amount of water in the lubricating or control system is normally maintained within the manufacturer’s specification by the plant’s oil-conditioning system. These systems often contain some type of demulsifying agent to remove water. Even if the water content is well above normally acceptable standards, the steel surfaces are usually kept wetted with oil, and corrosion (rust) is limited. However, when the turbine is shut down for weeks or months, water will generally separate from the oil in the pipes and components where the oil resides. If water separation occurs, it can corrode the equipment, support microbiological growth and/or affect the functioning of the control system. Additionally, when drained, large portions of the system normally filled with oil become exposed to the environment (air and oxygen). Obviously, the longer the duration a turbine lubrication system remains secured, the more time the equipment has to oxidize.

Particle Contamination


This orifice plug from a boiler feed
pump turbine control has deposits
covering the orifice holes.
Particle contamination not only can cause equipment to wear, but it also clogs lubrication ports, in-line filters and control systems. During operation, the parameters used to monitor oil tend to remain stable, but when the system that is designed to maintain lubrication and keep piping and hardware clear is secured, the rate of oxidation on the exposed surfaces increases. Then, when the unit is returned to service, the newly formed corrosion (rust) on any exposed piping or surfaces often is shaken loose or washed away with the restarted oil flow. Furthermore, where there are pockets in which stagnant oil may have settled, a slug of particulate and coagulating oil can easily form. When the oil flow is restarted, this particulate matter is easily pulled into the lubrication flow streams and circulated throughout the lubrication system.


One substantial area of concern is the control system. Because of the system’s complexity and low-flow velocity within the control piping, the system acts as a collection point for particulate.

Biological Growth

When a lubrication system is secured for prolonged periods of time, biological growth can occur. Low-flow areas can collect a tremendous amount of sludge over the years. With this amount of growth, a sudden change in the lubricating system’s temperature, such as that which occurs when returning the system to service, can result in the biological growth dying off and the remains being pushed through the system.

Biological growth, particulate and separated lubricant additives have
collected on this pump (above left). The lube oil cooler on the
right has biological growth and adhered lubricant additives.

Cleanliness Codes

Most plants have equipment monitoring programs that define lubricant property limits. These limits are usually established for normal operating conditions. One of the parameters typically monitored is particulate levels. The International Organization for Standardization (ISO) has developed a method (ISO 4406) for quantifying the level of particle contamination. The values gathered in a particle count test identify the number of particles in a given volume of fluid that are above a specific size range, which is generally set at 4 microns, 6 microns and 14 microns. The data is normally presented in a format such as 17/15/13, which provides a numeric range value representing the measured quantity of particles greater than 4 microns, 6 microns and 14 microns, respectively.

Case Studies

In a recent turbine outage, the lubrication system was placed into operation, and the main turbine was placed on turning gear. While the system was operating, an auxiliary filtration skid was connected to the main turbine reservoir to run in parallel with the normal filtration system. The skid had dual 7-micron filters and processed the main turbine reservoir four times per hour. An oil sample recorder pulled samples at 20-minute increments from the center of the turbine oil reservoir and then documented 31 hours of results from the mesh blockage particle counter.


Figure 1. The results from a mesh blockage particle counter revealed that a large amount
of contaminants were released into the lubrication system after 12 hours of operation.


As Figure 1 indicates, after approximately 12 hours in operation, a large slug of contaminants must have released into the system, causing the need to change filters. At that point, a decision was made to reduce the filter size and continue. Once the turbine was rolled, the auxiliary filtration unit was secured. Inspection of the last set of filters revealed a significant collection of particulate captured within the filters.

In another example, a filtration skid with a particle counter was tied into a turbine reservoir during the plant’s startup. This power plant normally only operates during peak summer months in the southern part of the United States, leaving it shut down for at least six months out of the year. The particle counter recorded main turbine reservoir contaminant levels above 4, 6 and 14 microns. Figure 2 illustrates the change in particulate levels from the time the turbine was on turning gear until the unit was synchronized to the power grid.


Figure 2. This graph illustrates the changes in oil particulate during the startup
of a turbine. The dash lines provide the lSO 4406 “alert” level for specific particle sizes.

Notice when the turbine rolled off turning gear and increased its speed to 2,400 revolutions per minute for thermal soaking, a large burst of particulate was released into the lubrication system. This caused all three particle levels to increase above the normal operating limits and remain high for more than two hours. Added filtration was able to bring the particle levels down to acceptable limits, but when the turbine speed was increased to synchronize the generator to the power grid, another spike occurred.

Plants generally do not monitor particle levels as equipment is placed back into service. When a turbine is at normal operating speed, the minimum oil film thickness between the turbine rotor and the bearing surfaces is in the order of 0.002 inches for journal diameters from 8 to 16 inches. The minimum film thickness increases to 0.010 inches for the largest journal bearings with 30-inch diameters. However, when the turbine is on turning gear, this oil film thickness is only a few microns thick at best.

As the speed increases, so does the film thickness between the rotor and bearings. If a large mass of particulate gets into a journal bearing when the film thickness is only microns thick, the particulate matter can scar or damage the journal and/or bearing profile, which in turn affects the fluid dynamics within the bearing. This often leads to overheated bearings and possibly to bearing failure.

To control particulate matter, it is better to use filter element sizes than ISO charts, since ISO charts allow a few large particles, which can lead to journal bearing failure.

Understanding what is occurring provides the best way to identify and assess risk. Once a risk is identified, actions can be taken, consequences evaluated, mitigations and contingencies developed, and an implementation plan pursued.

There are many ways to reduce risks when bringing large equipment back into service. A review of vibration data and other parameters can tell a lot about how the equipment performs when going from cold to normal operating conditions. It also will inform you of what is needed to extend the health of the equipment or increase the operating efficiency.


Connecting a kidney-loop filtration system to a tank or reservoir can help
reduce the risks when bringing equipment back into service.

Perhaps the most versatile and cost-effective method to help reduce the risk to equipment is to have a kidney-loop filtration system available. This type of system can be connected to a tank or reservoir to support bringing the equipment back into service.

The filtration unit should be sized to process the contents of the tank or reservoir several times per hour. In addition, the unit can be equipped with a cooler for summer months when thermal loads on the plant limit equipment operation. Along with filtering and cooling, a kidney-loop system can include a dehydrator, which provides an excellent way to extract water from the oil before placing the equipment on turning gear. This will reduce the amount of water that gets pushed through high-pressure differential regions of the oil film in the journal bearing and reduce the risk or amount of flashing, which causes damage and erosion of Babbitted and non-Babbitted surfaces.

Keep in mind that the expense of an auxiliary filtration skid can be quickly offset by a reduction in maintenance costs. In fact, the cost of replacing a damaged bearing or by keeping plant equipment running during peak summer months could easily justify reducing the risk of repeat failures. For example, a 10-percent power reduction at a nuclear plant during peak summer temperatures would pay for auxiliary filtration systems on most challenged equipment within days.

.

Thursday, 4 August 2016

New Advances in Wear Debris Analysis

Article extract from ReliaPlant newsletter:
http://www.machinerylubrication.com/Read/29029/new-advances-in-wear-debris-analysis-

The harsh work environments in which some industrial equipment is situated can lead to short life cycles and unpredictable failures, such as those found in mining or offshore oil and gas industries. While manufacturers may offer and honor time-based warranties, they cannot predict accurately the lifespan of the equipment. Moreover, replacement of equipment under warranty by the manufacturer does nothing to mitigate the cost of unscheduled downtime and lost revenues.


This Macro-2-Micro one-shot image of an
oxidized particle on a filter patch shows
surface detail that would not be visible
using a microscope without extended
focus capability.

A solution to this problem lies with the various fluid and particle condition monitoring tests that convey information about the current mechanical state of a system. In the front line of these is the collection and analysis of wear debris particles taken from a component’s lubricating or power transmission fluid. Wear debris analysis is so important because sampling is relatively simple to execute, the test is non-destructive and it can give a vital early warning of incipient component failure.

Particle Sizing and Counting Hardware

Particle counts can be determined using optical instruments. The first of these methods is to use a microscope. Particles are precipitated from fluid samples, which are taken from the component’s lubrication system, by draining through a filter patch. Particles are then interactively sized and counted manually using a microscope. However, because of its labor-intensive nature, this method was replaced by automatic particle counters (APCs) in the 1960s.

First-generation APCs contain a laser light source and a detector, which are separated by an optical cell. The oil sample flows through the cell, and when a particle passes through it, an area of light is obscured. The detector senses the loss of light and outputs a voltage. The voltage pulse generated increments the particle count, and the height of the pulse is used to determine the size of the particle.

These APCs have the disadvantage of not being able to distinguish between multiple particles, and because they are “blind” to the shape of the particle, they are only able to report size in terms of a projected area equivalent diameter. That is, size is defined as the diameter of the disc with an area equivalent to the area of the particle’s shadow. This method can lead to errors because the estimated projected area equivalent diameter is a function of the shape of the particle. In other words, the size of the particle is increasingly underestimated as the shape becomes more elongated. In particular, long, thin particles will be systematically undersized to the point where they may slip into a size range smaller than their actual size indicates or even disappear from the count all together.

A second generation of APCs has emerged that operates using micro-second duration-pulsed lasers. This has the effect of freezing the image of the particles present in the optical cell. The light sensor associated with first-generation APCs is replaced by a charge-coupled device (CCD) sensor. In this way, the system is able to collect the silhouette images of multiple particles. Image processing is then used to count and size the particles.

Various contaminants such as varnish or fibers have optical properties that make them invisible to APCs. These contaminants can build up to critical levels without being detected by the APC.

The ASTM D7596-11 standard test method for automatic particle counting and particle shape classification of oils using a direct-imaging integrated tester gives a list of 11 possible sources of error when using a second-generation APC. A relatively high level of skill and experience not generally available onsite would be needed to detect or control these errors.


This image of magnetic plug debris seen at
40x magnification includes a particle that an
inexperienced technician might mistake
for brass or copper.

Innovative Particle Imaging Hardware

New technology has recently become available that solves many of the practical limitations imposed by the traditional design of the microscope when viewing and capturing images of both macroscopic and microscopic particles. The new technology is dedicated to optimizing the lateral and axial resolution available at the magnifications and resolutions required to reproduce images in an electronic form, whether that is for data storage, printing in reports or for on-screen viewing. In this way, images can be generated in which the depth of focus and field of view are optimized for viewing macroscopic and microscopic particles at the same magnification.


Image-2-Information software reveals
that because the particle has a
non-uniform surface color, it is
not brass or copper but instead
a heated particle, indicating early
stages of lubricant starvation.


With the new technology, it is possible to acquire sharply focused images over a much wider range of magnifications and resolutions than when using a traditional microscope and without resorting to motorized stages or specialized software in order to create a wider field of view or extended depth of focus.

The image above shows a one-shot image of an oxidized particle on a filter patch. Without such a sharp image allowing the surface detail to be seen, this particle might be mistaken for a brass/copper fatigue particle, whereas it is a hybrid particle with striations associated with severe sliding and colors indicating heating.

This new technology can be implemented in such a way as to be sufficiently stable and compact to be used onsite. It also generates images at a size that can be transmitted electronically if more expert advice from a remote specialist laboratory is required.

Automatic particle sizing and counting software has also been developed for use with the new imaging technology. This software is uniquely “plug-and-play” and does not require the user to input subjective thresholds in order to distinguish particles from the background image. This makes it ideal for onsite use where the end user may not have the skill or training necessary to set image-processing thresholds. The new particle sizing and counting hardware and software technology is also compliant with ISO 4406 and 4407, NAS 1638 and SAE ARP598 standards.

From Images to Information

A new concept in wear debris particle analysis has been developed to specifically meet the needs of onsite technicians. This new software is compliant with and uses the particle classifications and nomenclature given in the ASTM D7684-11 standard guide for the microscopic characterization of particles from in-service lubricants.

The new software provides the onsite maintenance professional with access to an expert knowledge base of the fundamentals of wear debris analysis in order to assist in the identification of transitions between benign, active and critical wear patterns. By interacting with the software, the end user can access the following information:

  • The wear debris mode to which a selected particle belongs
  • The processes and conditions contributing to a particular wear mechanism
  • Information about equipment-specific wear modes
  • Wear debris analysis using equipment-specific baselines
  • When and how to correlate the data from other cleanliness tests with wear debris mode classification in order to identify transitions between normal, active and critical levels of wear
  • An alert when equipment health is critical and the onsite professional needs to call for remote support

These features make the new software ideally suited for onsite situations where the level of training and skill of the attendant technician may require substantial support.

In conclusion, it is clear that the fluid and particle condition monitoring needs of the onsite maintenance professional differ significantly from the resources required by the lab-based expert. The recent advances in wear debris particle analysis cater to this need for portable equipment that is both easy to set up and use while also addressing the variable level of skill and training of onsite personnel.

About the Author

Dr. Violet Leavers is an internationally acknowledged expert in machine vision and image processing. She currently works with V4L Particles Ltd. and can be reached via e-mail at v.leavers@V4L-group.co.uk.

About the Author
Dr. Violet Leavers is an internationally acknowledged expert in machine vision and image processing. She currently works with V4L Particles Ltd. and can be reached via e-mail at ...