http://www.machinerylubrication.com/Read/29122/inspections-improve-lubrication
In large industrial plants where a great number of machines are installed, it is necessary to implement an effective lubrication-management system. This type of system can help ensure that machines are well-lubricated and, if a fault or any abnormal situation is detected, further analysis or a corrective action can be carried out.
To make the system work, a machine database with well-defined lubrication points and scheduled lube routes is required. It is also essential to make good use of the data collected daily by the lubrication crew. If this information is promptly introduced into the database and generates an alarm when the machine is in poor condition, the reliability engineer can fix many potential problems.
The information collected by the
lubrication crew will help the
reliability engineer focus his
analysis only on the critical
machines and their
specific problems.
Lubrication routes and preventive maintenance (PM) can be modified automatically by lubrication software based on simple oil analysis and field inspection information provided by the lubrication crew. These tailored routes can improve effectiveness by focusing on critical machines, which are checked more frequently depending on the condition of the lube oil and the lubrication system.
When implementing such a system, several key factors must be taken into account to allow for the effective monitoring of the machines at a reasonable cost. The following tasks should be performed during the design of any lubrication-management system:
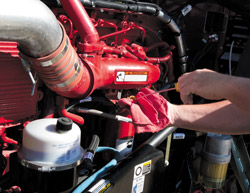
A field inspection should provide information on the lube oil system conditions and the mechanical condition of the machine.
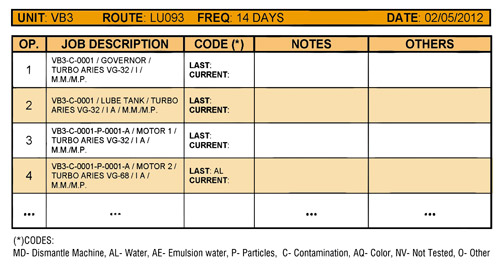
This template was designed for use as a lubrication route guideline.
If all of these steps are followed during the implementation of a lubrication-management system, it will be much easier to achieve the desired result in terms of machine reliability.
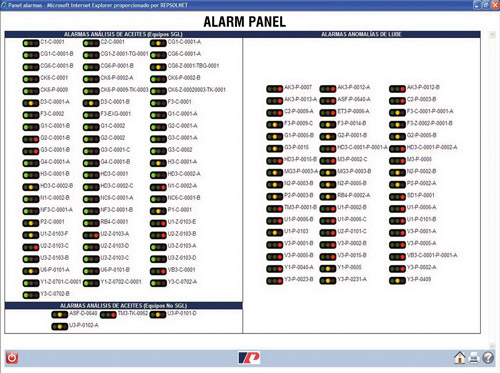
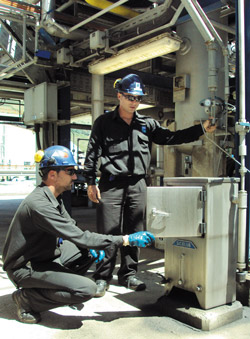
This is an example of a lube oil alarm panel.
In addition to performing all the work and inspections detailed in the routes, any qualified member of the lubrication crew should be able to:
If special care is taken during the filtering of the field information to register all of the data consistently and with a coherent structure, the task of the reliability staff will be simpler and the historic data will be easier to search.
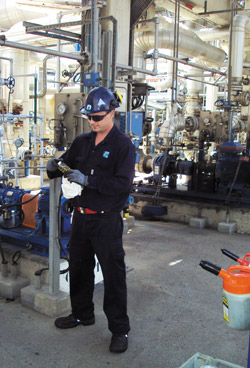
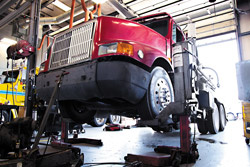
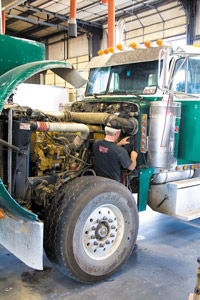
Qualified personnel is needed
to provide reliable information
regarding the lube and mechanical
condition of machines inspected during a route.
All of this information should be recorded by the lubrication crew in the report table of the route for the inspected machine. This data should be added to the system database as soon as possible in order to help the engineer promptly solve any problems detected within the machines. Remember, the reliability engineer takes care of the machines, and the faster the information is added to the system, the faster he or she can analyze the machine condition with the most advanced predictive technologies.
By updating your lubrication-route software, you can automatically include in the next planned route every lube point that has been found to be in poor condition. With this automatic process, the lube points that are deficient are revised more frequently until the correcting actions have the desired effect. An alarm system for the machine’s lube condition can also be implemented based on the information collected from the lubrication routes.
From this starting point, there are multiple strategies that can be implemented to optimize the lube-route schedule based on the machine condition and how often anomalies are detected. If an integrated system is employed, other information about the machine status can be used to improve the schedule and inspect the machines that are in poor condition more frequently. The difficulty lies in how to combine all of this data and find useful rules to be incorporated in the software. Any strategy should be in accordance with the general lubrication schedule and should not change planned work orders.
The lubrication frequency of points in poor condition that need to be inspected again will correspond to the maximum number of lube points included in the same processing unit of the plant. For example, let’s say the available lubrication frequencies in one unit will be a multiple of a fixed number of days (15, 30, 45, 60 days, etc.). This method allows the mechanical workshop to manage only the planned work orders. The difference is that the number of lube points will be slightly increased depending on the machine’s oil status.
A visual analysis of the
lube oil condition in the inspected
machine should be reported by
the lubrication crew.
There are other improvements that can be implemented when tailoring lubrication routes and PMs based on the information collected from field personnel, including:
Also, if the industrial plant has a computerized reliability system with predictive, preventive and other related machinery condition information, the combination of this data (such as vibration and oil analysis) will allow for improved system performance, as more complex and effective strategies may be used.
To make the system work, a machine database with well-defined lubrication points and scheduled lube routes is required. It is also essential to make good use of the data collected daily by the lubrication crew. If this information is promptly introduced into the database and generates an alarm when the machine is in poor condition, the reliability engineer can fix many potential problems.
The information collected by the
lubrication crew will help the
reliability engineer focus his
analysis only on the critical
machines and their
specific problems.
Lubrication Management and Scheduled Lube Routes
Before providing details on tailoring lube routes, let’s define what an effective lubrication-management system is as well as its main objectives. Generally, the purpose of a lubrication-management system is to schedule and plan the lubricating tasks of the machinery in the plant and to properly manage the field information supplied by the lubrication crew. The correct grade of lubricant also should be delivered to the proper lubricating points in the right quantity and on schedule to optimize the human and material resources.When implementing such a system, several key factors must be taken into account to allow for the effective monitoring of the machines at a reasonable cost. The following tasks should be performed during the design of any lubrication-management system:
Develop a Machine Database
This first step involves recording all the machines to be lubricated in a database, along with their lubricating points and the appropriate lubricant. The database should be flexible enough to adapt to such changes as machine revamps or oil type upgrades. It should also allow for the historical recording of incidents that are documented on the lubrication routes.A field inspection should provide information on the lube oil system conditions and the mechanical condition of the machine.
Audit Lubricant Types
Once a machine database has been developed, the location of the lubricant service stations and the machines that use those lubricants must be studied in order to optimize the distance travelled by the lubrication crew. At this point, it is also important to standardize the lubricant types to a minimum that meets the machine manufacturer’s requirements.Create Lubrication Routes
The lubrication specialists or the reliability engineers must create the lube routes. These routes consist of a series of points to be lubricated (divided into geographical areas or into production units) with related tasks to be performed on a detailed schedule.Design a Template
A template can be designed for use as a lubrication guide when performing field work. The template should include all the relevant information for the lubrication operators such as identification numbers of the machines to be inspected, lubricating points, the lubricant to be used at each point and tasks to be performed. There should also be open fields in the guide table in order to note any observation or anomaly detected.Establish a Procedure for Work Orders
Lubrication work orders should be generated with a frequency that allows for proper planning of the work and should be delivered with the specific work plan attached. Also, be sure to print and detail the work plan for the personnel who will actually carry out the job to avoid unscheduled work and downtime.This template was designed for use as a lubrication route guideline.
Determine Who Performs the Lube Routes
It is important to decide which members of the staff will be in charge of lubricating the machinery to avoid delays in the task execution. Keep in mind that in this type of work, any problem will affect all subsequent lubrication routes, which can cause serious damage to machinery.If all of these steps are followed during the implementation of a lubrication-management system, it will be much easier to achieve the desired result in terms of machine reliability.
The Importance of Reliable Field Data
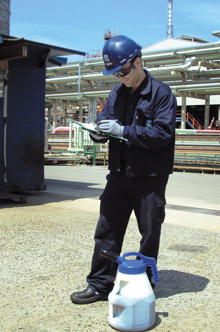
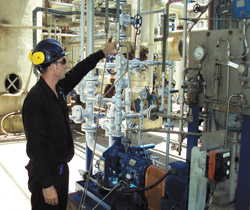
Once the lubrication plan has been created and the material and human resources required are clear, it is essential to utilize qualified personnel (or contact a qualified lubrication company) to carry out the lubrication tasks. Qualified personnel is needed not only to perform good quality work but also to provide reliable daily information regarding the lube and mechanical condition of the machines inspected during the route.This is an example of a lube oil alarm panel.
- Carry out simple corrective maintenance jobs related to the lubricating systems.
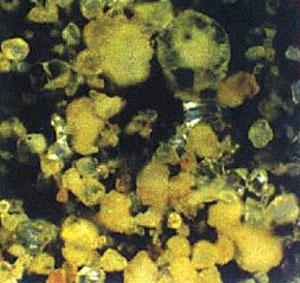
- Perform quick visual inspections of the lube oil quality (moisture, particles, color, debris, etc.) and report its status in the lube route guideline table.
- Ask his or her manager or the reliability engineer about further analysis of critical machines that are considered to be in poor condition.
- Report any other observed anomaly that could affect the machine or personal safety.
If special care is taken during the filtering of the field information to register all of the data consistently and with a coherent structure, the task of the reliability staff will be simpler and the historic data will be easier to search.
Using Field Inspections from Lube Routes
Depending on the work experience of the lube staff and the available time intended for the lubricating tasks, the lubrication operator should provide the following information about the machine condition:- Visual analysis of the lube oil condition (water contamination, debris, oil temperature, color, etc.)
- Lube oil system condition (oil leaks, tank cleanliness and superficial condition, oil filters, oil drains, etc.)
- Mechanical condition of the machine (vibration, noise, bearing temperature, etc.)
- Miscellaneous (information on new machinery installed at the plant, reports of other problems in the plant that affect the lubricated machines, etc.)
Qualified personnel is needed
to provide reliable information
regarding the lube and mechanical
condition of machines inspected during a route.
All of this information should be recorded by the lubrication crew in the report table of the route for the inspected machine. This data should be added to the system database as soon as possible in order to help the engineer promptly solve any problems detected within the machines. Remember, the reliability engineer takes care of the machines, and the faster the information is added to the system, the faster he or she can analyze the machine condition with the most advanced predictive technologies.
By updating your lubrication-route software, you can automatically include in the next planned route every lube point that has been found to be in poor condition. With this automatic process, the lube points that are deficient are revised more frequently until the correcting actions have the desired effect. An alarm system for the machine’s lube condition can also be implemented based on the information collected from the lubrication routes.
From this starting point, there are multiple strategies that can be implemented to optimize the lube-route schedule based on the machine condition and how often anomalies are detected. If an integrated system is employed, other information about the machine status can be used to improve the schedule and inspect the machines that are in poor condition more frequently. The difficulty lies in how to combine all of this data and find useful rules to be incorporated in the software. Any strategy should be in accordance with the general lubrication schedule and should not change planned work orders.
The lubrication frequency of points in poor condition that need to be inspected again will correspond to the maximum number of lube points included in the same processing unit of the plant. For example, let’s say the available lubrication frequencies in one unit will be a multiple of a fixed number of days (15, 30, 45, 60 days, etc.). This method allows the mechanical workshop to manage only the planned work orders. The difference is that the number of lube points will be slightly increased depending on the machine’s oil status.
A visual analysis of the
lube oil condition in the inspected
machine should be reported by
the lubrication crew.
There are other improvements that can be implemented when tailoring lubrication routes and PMs based on the information collected from field personnel, including:
- The status of the lube point inspected in the last route can be included in the guideline table for the next route. This allows personnel to pay more attention to the most critical points.
- Any valuable information or pending work orders on the machine can be included in the guideline table and taken into account by the lube operator.
- Any automatic alarm or advice intended for taking further action like oil analysis, vibration measurements, etc., will improve the performance of the system.
- Other information based on the machine type and the organization of the reliability and maintenance departments can be utilized.
Also, if the industrial plant has a computerized reliability system with predictive, preventive and other related machinery condition information, the combination of this data (such as vibration and oil analysis) will allow for improved system performance, as more complex and effective strategies may be used.
 As I’ve gotten older, I have tried to curtail my consumption of fast food. I’m aware that the fat content, calorie counts and general nutrition levels are not the healthiest available. I know that as we age, we should watch our cholesterol, our weight and make sure that we eat healthy. I also know that my diet will directly contribute to the length and quality of my life. With all that being said, I love fast food. I am usually pretty good at keeping a balance of healthy eating and not-so-healthy eating, but sometimes I just want something that comes quickly and cheaply even though it may not be the best thing for me.
 The selection of breathers and monitoring breather condition provide another method of reducing ingression. Whether you are using them to eliminate dirt or water ingression, breathers are imperative for machine health. They must be selected according to the machinery conditions and environment. Frequently, breathers are not monitored properly. Like oil filters, they have an intended purpose and function well; however, once they reach the end of their life cycle, it is important to replace them promptly.
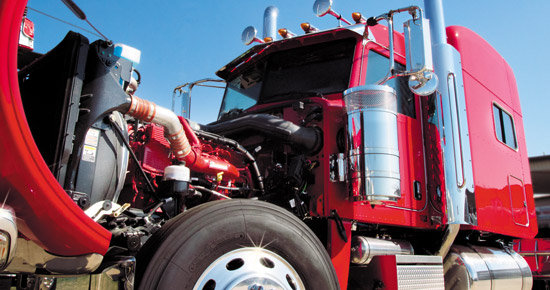

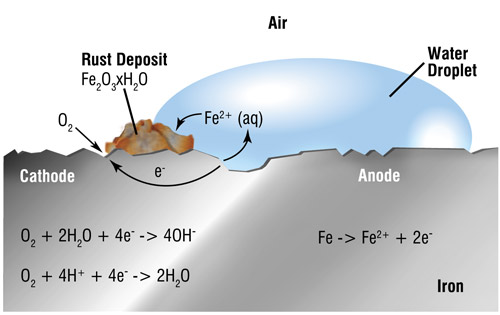
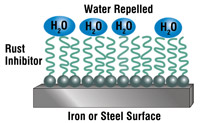 The best way to stop rust and corrosion is not to allow the metal to come in contact with water, oxygen or acid. In essence, this is exactly what rust and corrosion inhibitors do. These additives are typically compounds that have a high polar attraction toward metal surfaces. They chemically bond to the metal surface, forming a protective film over the underlying metal. This film acts as a barrier that does not physically allow the metal to come in contact with anything that could promote corrosion. Some popular compounds being used are amine succinates and alkaline earth sulfanates.