Showing posts with label Reliability. Show all posts

Thursday, 17 November 2016

The Plant Maintenance Program

Article extract from ReliabilityWeb newsletter:
http://reliabilityweb.com/articles/entry/the_plant_maintenance_program/

The program explains and prescribes what personnel do and who does what, how, when and why? The personnel involved are more than those in maintenance. They also include all who support maintenance, such as warehousing, or depend on maintenance services, as with production.

The success of all maintenance functions is enhanced with a program commonly understood across the entire operation. But, the most important aspect of all is to ensure that those other departments that must support maintenance or utilize its services know how. If they don’t know what maintenance wants and needs, they cannot deliver it. There is an axiom that suggests: If you want someone’s help, you must first tell them how they can help. More simply: No tell; no help.

Maintenance is not a stand-alone effort. Any successful effort to improve maintenance performance, regardless of how, depends on the quality of the plant maintenance program. It’s important to note that it is the plant maintenance program, not the maintenancedepartment’s maintenance program. Maintenance is a service provider, dependent for success on the cooperation and support of all other plant departments and the backing of a supportive plant manager. Maintenance is not to be carried out single-handedly by maintenance. Planning, for example, is a key maintenance function and the responsibility for successful planning rests solely with maintenance. But, the planning function requires the support of numerous plant departments, like warehousing, purchasing, shops, accounting, etc. Few maintenance functions are successful without help and cooperation from other departments.

Getting Started
Only the plant manager controls all departments. Therefore, the existence of a quality plant maintenance program is the responsibility of the plant manager. However, the maintenance manager is responsible for the effective execution of the elements of the plant maintenance program. Yet, the maintenance manager depends on all other departments in order to execute the plant maintenance program. Thus, the plant manager becomes responsible for ensuring the support and cooperation of other departments, which, in turn, ensure the success of maintenance. What must the plant manager do? Based on the corporate business strategy, the plant manager, as shown in Figure 1, develops a business plan (1), assigns departmental objectives specifying responsibilities for primary operational or support activities to include interactions with maintenance (2) and specifies policies for the conduct of maintenance (3). In turn, departments acknowledge objectives and follow policies as they incorporate all experiences with merit (4) and follow principles (5) to develop internal and interdepartmental procedures (6). Procedures are then incorporated into departmental programs (7) and information systems utilized to control actions (8). Once tested, departments organize to support programs (9) and interact according to approved program details (10). Thereafter, information is used to control and manage the overall operation (11).

It follows that the best maintenance organization must be capable of executing the what, who, how, when and why of the plant maintenance program. And the best information system is the one that provides the right information to ensure efficient execution of the what, who, how, etc., specified in the program. It is reasonable to state that modern strategies, like reliability centered maintenance (RCM), cannot be successfully implemented unless there is a plant maintenance program, organization and information system to support them. It logically follows that only when a plant and its maintenance department have solidly locked down what they do, how, etc., can they confidently choose the best organization and a competent information system to carry out and control plant maintenance activities.


Figure 1
Program Development
Program definition begins at the plant manager level. This individual states how the departments should work together efficiently and productively by assigning specific objectives. The plant manager provides policies so departments are guided as they develop internal and interdepartmental procedures that make the plant’s maintenance program work efficiently.

Effective maintenance and actions that assure reliable equipment and workforce productivity don’t simply happen! They happen only after clear, logical management guidance is provided and a quality program emerges.

Program definition is a composite interaction of all departments. As they work together, maintenance crews, equipment operators, supervisors and staff personnel, like planners, warehouse personnel, or purchasing agents, should confer as the procedures for each department are being developed and interdepartmental actions confirmed. This collaboration better assures the practicality and workability of the final program.

Program education is essential and must include everyone in the plant, from worker to manager. Plant managers should make a special effort to observe the discussion between departments as they commit to procedures necessary to carry out the plant’s business plan. Questions should be answered promptly and correctly. Recommendations should be welcomed and encouraged.

Program Definition Techniques
The most effective technique for documenting the program is a schematic diagram that depicts the interaction between individuals of participating departments. The schematic is accompanied by a legend to aid understanding of the step-by-step process. While other techniques, such as flow charts, decision trees, or narratives, with diagrams might be used, none are as effective as the schematic diagram in showing people’s interactions. The schematic pinpoints ‘you’ and ‘me.’ It describes directly what ‘we’ must do, how ‘we’ will do it and the results ‘we’ should achieve. It is this ‘personal’ explanation that helps to bind people to the program.

As Figure 2 illustrates, preventive maintenance (PM) services due are shown by the information system (1). Services on equipment due (2) are either static (require shutdown) or dynamic (done while running). Static services are integrated into the weekly schedule and operations is advised of the approved, scheduled shutdown times (3). Dynamic PM services are done at the discretion of the maintenance supervisor (4). The maintenance supervisor assigns PM services to individual crew members (5). Services are performed by maintenance crew members (6) and crew members confer with operators to learn about actual equipment condition (7). Operators assist according to their instructions (8), while operations supervisors are advised of new deficiencies by the crew member (9). Deficiencies are then reviewed by the maintenance supervisor and the crew member (10) and converted into work as follows: Emergency repairs - Supervisor assigns at first opportunity (11); Work that meets planning criteria requiring planning - Supervisor forwards to planner (12); and Unscheduled repairs - Crew member enters them into the work order system as new work to be fitted in at first opportunity (13).

Figure 2
Conclusion
It is always prudent to ensure that everyone in an industrial organization understands their operational, support and cooperative roles and responsibilities. When this happens, the plant maintenance effort will be successful.
Paul D. Tomlingson, retired, is a 44 year veteran maintenance management consultant focusing on heavy industry. Mr. Tomlingson is the author of eleven textbooks and over a hundred published trade journal articles. He is a graduate of West Point and received a BA in Government and a MBA from the University of New Hampshire.

The Risks of Cutting Maintenance Costs

Article extract from ReliablePlant newsletter:
http://www.reliableplant.com/Read/29615/cutting-maintenance-costs


In our competitive environment, every manufacturer struggles to do more with less and to find capital for "nonproduction" areas, such as maintenance, safety, training, housekeeping and human resources. If done in a short-sighted fashion, the employer learns through painful experience the sacred law of "unintended consequences."

A recent magazine article detailed the harm to production and profits that resulted from gradually shifting almost all maintenance functions to production employees. You're probably thinking, "I wouldn't do that," but many employers have eliminated certain housekeeping workers and relied upon production employees to clean up their area or machine.

Let me share some of my experiences where "nonproduction" functions were neglected:

At one company, management of change (MOC) was overlooked as conveyors were modified and used machines and lines were added. Overstretched plant engineering and maintenance departments missed the new point of operation and other areas requiring guarding. Interlocks were not connected. Holes were left in boxes and panels. Lockout training was not updated. No annual evaluation of lockout was connected, and training was not revised. After an injured line employee complained to the Occupational Safety and Health Administration (OSHA), the agency issued hundreds of thousands of dollars in citations and penalties relating to guarding, lockout, training and electrical violations. Even worse, the company has significant "repeat" citation OSHA exposure throughout its many plants.

At another plant, the overall safety responsibility was shifted to a production supervisor (or maintenance or lab director, etc.), and the plant safety manager was laid off. The supervisor/safety manager responded to the loudest voice (the production manager) and the seemingly most urgent matters (getting product out the door). A worker was killed but not "directly" because of safety lapses (a poor safety culture was a factor), and OSHA learned that new hires had not received proper training. Written policies looked good until the company terminated the safety manager, so the decline in compliance was even more glaring. The poor pseudo safety manager was so underwater that he never acted on the recommendations from the last three yearly audits by the insurer, so OSHA cited the employer for numerous willful citations.

A third company didn't feel that it could retain additional experts and relied on its own staff and its general mechanical contractors to select and install new food production lines. These individuals were actually solid people, but they did not have experience with the process hazard analysis (PHA) experience in selecting and operating lines with combustible dust issues. After several hundred thousand dollars in OSHA citations and retrofitting costs, the organization now wishes it had spent the money on a full-time safety manager and used a consulting engineer with combustible dust experience to address system design and management of change issues.

These are safety and engineering-related "unintended consequences." Don't get me wrong. I embrace the lean movement and realize that sometimes you have to select the "least bad option," but you must also think ahead.

About the Author
Howard Mavity has practiced law for nearly 30 years and is the founder of the Fisher and Phillips Workplace Safety and Catastrophe Management Practice Group. He ... 

Thursday, 10 November 2016

Stay Focused to Sustain Reliability

Article extract from Reliable Plant newsletter:
http://www.reliableplant.com/Read/29344/focused-sustain-reliability

A terrorist with a bomb passes through airport screening undetected on Christmas day. If not for a failure to detonate, many lives would have been lost.

When this brazen attack occurred, one of the things made evident was that many of us had let our guards down since 9/11. We had grown less interested than we once were.

I recognize this in a related area of my professional life. When I am not working on maintenance systems, part of my consulting practice is in "food defense," the concept of keeping the bad guys from intentionally contaminating our food supply.

There was significant interest in this topic after 9/11, as you might imagine. I regret to share with you that today there is far less interest, at least in the United States. Paradoxically, workshops I have taught in Peru, Thailand, Panama and the Caribbean have received considerable interest from their governments, universities and food industry (factories).

I have a couple of theories why corporate America is so short-sighted. One is that our public-company, quarterly-results-driven world trains us to think and work short term instead of long term. The other is related to a term no longer in vogue but recognizable to all of us in manufacturing: the "flavor of the day."

I think this phenomenon has gotten worse in our current downsized economy. We have cut beyond the fat into the bones of our organizations. We have let so many people go that we can barely do our daily work and certainly don’t have the means to pursue more than one or two improvement initiatives.

So we went from responding to the airline terror of 9/11 and food terrorism concerns to the bird flu preparations, to the swine flu response and to the economic downturn. At each juncture, we left behind an unfinished plan or a newborn program left to die of atrophy. This was without malice but also without the energy and resources to keep multiple programs sustained.

We have seen the same with industrial plant maintenance. The total productive maintenance and condition-based maintenance initiatives of the 1980s were never finished or sustained. They were replaced with the proliferation of product forms in the booming 1990s, the packaging initiatives of the early 2000s, the "green" initiatives of recent years and the cost-saving cuts of the past few years. As a result, many of our maintenance programs have failed to advance in the last 20 years.

We need to learn from the airlines, which have largely sustained robust maintenance and reliability programs (albeit under Federal Aviation Administration regulation). We cannot let our guard down — not in our preparations against terror in the skies, not in our defense of the food supply and perhaps, with less life-threatening drama, not in our maintenance and reliability initiatives.


About the Author
Ned Mitenius, PMP, began his career supervising a submerged nuclear reactor. He has spent the last 20-plus years in the food manufacturing industry, saving companies like Minute Maid, Ocean Spray ... 

Tuesday, 8 November 2016

Reduce Costs with MRO Data Cleansing

Article extract from Reliable Plant newsletter;
http://reliableplant.com/Read/29360/mro-data-cleansing

As competition and technology continue to evolve in today’s industrial and manufacturing industries, companies are faced with the ever-increasing challenge of reducing costs and improving efficiency while maintaining production quality. These manufacturing companies often have multiple sites spread across large geographic regions, each with thousands of maintenance, repair and operations (MRO) spare parts on hand to keep operations running. In such large organizations, several different employees enter items into various enterprise asset management (EAM) systems at each site, with little or no standard guidelines, and often in multiple languages. Over time, this lack of standardization causes materials data to become inconsistent and inaccurate, resulting in many negative effects that can be felt throughout all units of the business.
The most common effects caused by corrupt materials data include:
  • Unidentifiable items
  • Excess inventory
  • Duplication
  • False stock-outs
  • Equipment downtime
  • Inefficient part searches
  • Increased maverick purchases (direct buys)
  • Limited benefits from EAM systems
These inefficiencies can cost companies significant time and money, while preventing them from making critical data-driven decisions.

The Data-Cleansing Process

In order to transform corrupt data into consistent quality data, a data-cleansing process must be implemented to create one common corporate catalog that can be maintained throughout the entire organization.

While the data-cleansing process may appear very simple in nature, it requires a very unique and specialized set of software, people and procedures. Some data-cleansing companies pride themselves on efficiency and speed through the use of automated software, but in reality, there is no software application that can accurately cleanse mass data files without human intervention. The data-cleansing process is actually much more detailed, and for the most accurate results, requires the use of automated software applications combined with the involvement of cleansing specialists to ensure consistency, accuracy and efficiency.   

To illustrate the data-cleansing process from start to finish, it has been broken down into nine steps. While every project is different based on specific customer requirements, these nine steps cover the standard procedures involved in every data-cleansing project.  

Step 1 – Segregate and Standardize the Manufacturer Name and Part Number

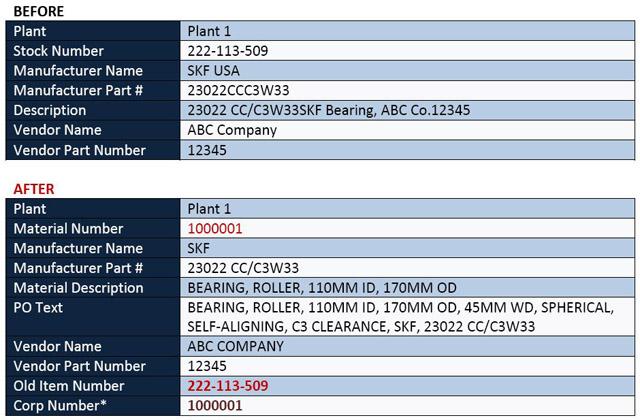
Using automated software, the manufacturer name and part number are extracted and segregated from the unstructured free text description. Once segregated, the manufacturer name and part number are corrected and standardized, ensuring each unique manufacturer name and part number maintains one consistent structure throughout the entire database.

Step 2 – Assign Noun-Modifier and Required Attributes

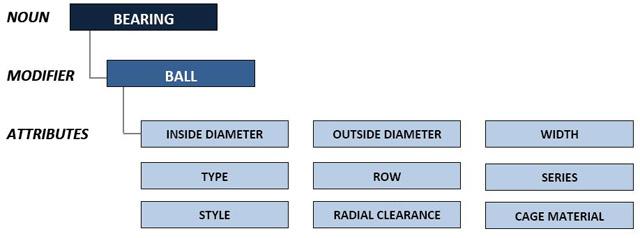
Following the segregation and standardization of manufacturer names and part numbers, a noun-modifier dictionary is used to assign the correct identifier and descriptive properties for each item. As illustrated below, using the noun-modifier dictionary, each item is assigned a noun-modifier pair, where the noun is the primary identifier and the modifier is the secondary identifier. Each noun-modifier pair also contains on average five to seven associated attributes, which further describe the characteristics of that item.

Step 3 – Populate Attributes

After standardizing and populating information provided in the customer’s raw description, the remaining attributes are populated using internal and external tools such as the master parts library, which contains millions of pre-standardized items. An online research tool assists in the search and collection of additional part information. Using these powerful tools, item descriptions are accurately and efficiently enhanced with information retrieved directly from manufacturer catalogs.

Step 4 – Assign Classification Codes

Once all items have been correctly described by a noun, modifier and corresponding attributes, they can be assigned customer-specified classification codes. The classification codes are typically used for commodity segmentation, spend analysis and other custom reports, enabling companies to leverage purchases and gain insight for improved procurement-related efficiencies.

Step 5 – Identify Duplicate Items

After cleansing and classification is complete, duplicate items within the database are identified by direct duplicate (same manufacturer name and part number) or by form-fit-function (different manufacturer name and part number but identical according to type, size and material). Once duplicates have been identified, they are assigned one common corporate part number, descriptions are duplicated to appear identical throughout the database, and the items are flagged for customer review.

Step 6 – Quality-Control Review

Due to the emphasis on quality and consistency, the next step involves a final human review of all items, typically conducted by an assigned project leader or dedicated quality-control person. The quality-control process ensures that every item follows proper format and nomenclature according to pre-defined customer standards, while verifying that enhanced descriptions are correct, accurate and complete.

Step 7 – Send Review List to Customer

On average, 10 percent of the materials database is usually found to be review items, meaning items lacking critical information for accurate part identification such as manufacturer name or part number. During the data-cleansing process, these items are flagged and compiled into a customer review list. The review list is returned to the customer, who must then physically locate the item within the storeroom and record the necessary part information to be added into the material master.

Step 8 – Format Data to Customer ERP System

Once the missing information has been collected for all review items and the entire cleansed database has been approved by quality control, it is deemed complete and transferred to the IT department. At this stage, IT specialists format the data to the customer-specified enterprise resource planning (ERP) system and extract it into a return file. The formatting stage is critical to achieving the desired end result, as every ERP system has its own unique layout, headers and field limitations.

Step 9 – Return Cleansed File

Once the entire data file has been cleansed, standardized, enhanced, de-duplicated, reviewed and formatted to the customer’s ERP system, it is electronically delivered to the customer. At this time, the data can now be uploaded directly to the customer’s ERP system.

The Results

Esthetically, the results of data cleansing are obvious, as the data now clearly maintains one consistent format and nomenclature throughout the entire organization while containing enhanced information for improved part identification. However, the real benefits are those that may not be as visually obvious but present the greatest return on investment. The most valuable benefits are those that come from the ability to identify and remove excess, obsolete and duplicate items while improving the ability to quickly search and locate parts when time is of the essence and minimizing equipment downtime is crucial. Key benefits include:

1. Cost reduction
  • Identification of excess-active and obsolete inventory
  • Identification and elimination of duplicate items
  • Reduction of equipment downtime
  • Reduction of maverick purchases
  • Reduction of expedited part orders
2. Improved maintenance efficiency
  • Efficient part searches
3. Maximum ERP/EAM benefits
  • Improved reporting capabilities  

From a long-term perspective, quality materials data is the key to maintaining operation costs and efficiencies. This process does not end once the data-cleansing project is complete. Maintaining ongoing data quality requires a strict set of catalog management procedures to ensure accuracy and consistency as new items are added and existing items are modified or suspended. Most data-cleansing companies offer some type of catalog management software or service for customers to maintain the quality of their cleansed catalog. However, unless the customer is able to dedicate an internal resource to manage the catalog, outsourcing this activity to the experts who originally cleansed the database will always deliver the best results.

About the Author
Jocelyn Facciotti is the marketing manager at I.M.A. Ltd., a company specializing in MRO data cleansing and related services. For more information, visit www.imaltd.com or contact info@imaltd.com.

Monday, 7 November 2016

Proactive Lubrication in Practice

Article extract from ReliablePlant newsletter:
http://conference.reliableplant.com/proactive-lubrication/

Several reliability studies have identified that approximately 70% of all equipment failure is attributed to lubricant contamination. What this is really telling us is that approximately 70% of all potential equipment reliability gains can be obtained with a proactive lubrication program. One of the biggest opportunities for increasing equipment up time and reducing maintenance cost is in the field of lubrication.

What is proactive lubrication? We are all aware of the critical roll lubrication plays in equipment function, but what is the meaning behind proactive lubrication? Below is a common definition of proactive:

[Pro + reactive]: acting in anticipation of future problems, needs, or changes.

Given the definition of proactive, I believe it would be accurate to say that proactive lubrication is the application of lubricants with the intent of reducing or eliminating future failures or faults that could be addressed through lubrication. This does not mean simply checking fluid levels, performing the required oil changes and putting a shot of grease in a bearing when it is starting to make noise, but actively seeking ways to extend equipment life and improve its function.

Most machinery rides on a film of lubrication. Theoretically if we can provide a film of oil that will never allow metal to metal contact and is free of contaminants that can abrade and wear on opposing surfaces, the machine should run forever. Well theory is nice to talk about, but we don’t live in a perfect world. Contaminants do get into oil and we have operating conditions that constantly challenge the integrity of the lubricants we use. If we refuse to accept the common mentality of good enough and focus on improving fluid cleanliness, there is big money to saved everywhere!

This article will first discuss filtration, followed by a real life case study supporting the argument that improved fluid cleanliness is a big hitter when it comes down to cost savings and the bottom line.

Filter Ratings

When considering filtration choices don’t be fooled by the advertising. Filter manufacturers have one goal, to sell their filters! Salesmen are not commonly concerned about which brand of filter is best for your application; they are determined to convince you that their brand of filters are the best thing since apple pie and baseball.

Be careful when looking at filter specifications. Some filter manufacturer’s rate filter performance with a simple micron rating, like “3 microns”. A rating such as this actually tells the consumer very little about how the filter will perform in a real life application. Another ploy in advertising is to advertise an efficiency rating in percent of efficiency at a certain micron. The better quality filters are commonly advertised with a Beta Ratio rating.

Beta Ratio

The beta ratio rating of a filter is be expressed something like this “β3µ=1000” which means the beta ratio for 3 micron sized particles is 100. What this is saying is that for every 1000 particles 3 microns in size, that enter the filter, only 1 will pass through. Likewise, if a filter is rated β3µ=200, for every 200 particles 3 microns in size, that enter the filter, only 1 of those particles will pass through the element. Below is a visual representation of beta ratio that effectively illustrates the meaning.

Proactive Lubrication Beta Ratio
(Courtesy of HY-PRO)

The test for beta ratio ratings is effectively standardized, but not absolute; what I mean to say is that the test cannot emulate the varying operating conditions a filter will encounter in real life applications, but it does provide a standard for comparison.

To illustrate the significance of beta ration ratings, the following case study is provided:

The test was conducted on a 300 gallon rolling oil system that is used to flood work rolls as material is passed through a cold rolling mill. The oil drains into an open sump and is returned to the reservoir by a transfer pump. The particle count was conducted in house, through a minimess port, with an on sight particle counter. Both test were taken under similar operating conditions and are representative of the average from several test that were conducted. The first test report represents the performance of a name brand filter element with an advertised performance rating of β3=75 and the second test was taken after replacing the original element with one that has a rating of β3=1000. (The particle count represents the number of particles per milliliter of fluid)

Cold Mill Rolling Oil

Thinking back to when I started my career as a maintenance lubricator I did not fully understand the significance of filter ratings and in no way would not have expected such a difference between two filters with the same micron rating. Obviously the results identify significant disparities in the single pass efficiency of the two filters.

This presents a common problem for many trained lubricant professionals when it comes time to order filters through the purchasing department of their companies. If the call out is for a 3 micron filter, the purchaser will first look for a 3 micron filter rating and then (commonly from pressure to reduce cost) look for the cheapest 3 micron rated filter they can find. The problem is that you commonly get what you pay for! In the above case study, the β3=75 filters cost about $50 each and the machine takes 6 filter elements per change out, for a total change out cost of $300. The elements were changed semi annually, on a scheduled PM work request, for a yearly total of $600. The β3=1000 filter elements cost around $130 each and are changed out 3 times year (change out intervals were modified as determined through condition based monitoring) for a total annual cost of $2340.00. So what is the company gaining for the extra annual expense of $1740.00?

Within 6 weeks of implementing the filtration system upgrade, the department engineer approached the lubricators and asked if we had implemented the proposed upgrade yet? Management was seeing a 10% product yield increase through final inspection due to surface quality improvement, but could not identify where it was coming from. It was from improved lubricant cleanliness and saves the $100,000.00 a year! As an added benefit, the bearings that support the work rolls are also lubricated by the rolling oil. Work roll bearings have customarily been changed out at six month intervals, the current set of bearings have exceeded twice the life expectancy and are still going strong. If this pattern of increased bearing life repeats, there will be a verifiable reliability improvement with a cost savings of $140,000.00 a year. That is a total savings of $240,000 a year!!

In a nut shell, the purchasing agent can save the company $1740.00 a year by buying cheaper filters, but a pro active lubrication strategy saved the company just under a quarter million dollars a year by identifying an opportunity for improvement and spending a little more on filtration.

The above case study is not an isolated occurrence or the largest realized savings we have seen from employing a proactive approach to lubrication. We have realized significant decreases in mean time between failures, increases in equipment uptime due to improved reliability and in some instances product improvement due to better responsiveness from the machines controls.

When initiating a lubrication improvement, please take every opportunity to measure the fluid condition before and after the modification. Document the gains, work with production, engineering, purchasing and management to document, implement and measure the improvements. If you can’t show a gain, you will not invoke the support of your company and there will likely be no opportunity to prove and advance proactive lubrication practices in your facility. The value of proactive lubrication practices is largely overlooked and until you can document gains, management will not be able to realize the value added.

Training

Lubrication is a maintenance trade, without the proper training it is difficult to become proficient at it. A facility that is serious about equipment reliability will seek to train their lubricators and recognize the value in a skilled and dedicated lubrication program. From a professional standpoint, seek to obtain all of the training that is offered. I am fortunate to work in a facility that believes strongly in the value of pro active lubrication techniques and has eagerly encouraged and supported advanced lubrication training to anyone that is willing to work at it.

Because of the opportunity afforded to me by my employer, I have benefitted by receiving training from top notch companies like Noria, Lubrication Training Consultants (LTC), SKF, Chevron University and The Society of Tribologist and Lubrication Engineers. (STLE) With the training I’ve received, I have been able to obtain numerous certifications that have significantly improved my knowledge, enhanced my skill level and helped me to advance within my company. To an employer that may be reading this article, I would like to say that if you have a maintenance employee who wants to put the extra time and effort into training and certification, it will likely pay big dividends. If you are an employee reading this article and your employer is willing to invest in training and certification, jump on it!

This article was previously published in the Reliable Plant 2013 Conference Proceedings.
By Dale Jones, Allegheny Wah Chang

The Journey to Reliability Uncovers a ‘Hidden Plant’ Within the Walls


Those working in the field of maintenance know how important it is to the success of any organization to maximize reliability and minimize or eliminate unscheduled downtime. This can be a daunting task and often requires professional collaboration, a change in organizational culture, and the willingness and ability to make decisions that are not always popular.

Lubrication Engineers (LE) is no different than any other manufacturing facility in the world. It can only make a profit if it is producing quality product and shipping it to customers in a timely fashion. If the facility experiences unscheduled downtime with its production equipment, it causes a ripple effect throughout the entire operation. When this happens, the organization seeks to learn from it and get better to minimize the risk of it occurring again.

LE manufactures its own high-performance industrial and automotive lubricants in its 200,000-square-foot manufacturing and warehouse facility. Its products are distributed and used by companies all over the world (Figure 1). As a batch process manufacturer - as opposed to a continuous process manufacturer - LE is able to give each product an intensive care approach during the cooking and blending steps. It formulates its products to meet the needs of the application and not just to meet minimum specifications.


After the finished product is approved by quality control, the product handling department fills containers ranging in sizes from pint bottles to tanker trucks. Product is stored in three warehouses across the United States, which helps lessen the delivery times to customers in various regions.

All this may sound good, but LE is never satisfied with the status quo. The company works continually to maintain or improve mechanical uptime in order to provide quality product and reliable service to its customers. Seven years ago, LE had some challenges to overcome. The biggest challenge was the need to change the reliability culture in the entire facility. While LE was already very good at helping its customers improve lubrication reliability and mechanical uptime, the company knew it could do better in its own facility. The organization needed to walk the walk, not just talk the talk.

LE needed to focus on managing its assets at a higher level than ever before. The company initiated plant-wide meetings to discuss reliability topics. Discussions focused on reliability in terms of how it relates to its employees, as well as its customers. LE determined that it could do better in its reliability efforts and save money by doing so.

Getting Started

The beginning of a reliability journey can seem overwhelming, but that is why it is so important to be patient and take one step at a time. Although it would seem easy for a company like LE to get started because it already partners with reliability-minded product and service providers, its reliability journey still sputtered, at best, in the early stages, even with this built-in advantage.

Top-Down Support

It was imperative that senior management recognized that good lubrication practices would protect assets and keep them generating products and profits, positively affecting the bottom line. LE also needed its leaders to place equal importance on both human and mechanical assets.


Education & Training

LE chose to spend money on its people to get them the training they needed. The maintenance team and senior management attended maintenance reliability conferences and as many training opportunities as possible. Many were able to earn certifications, including Machinery Lubrication Technician Level I (MLT), Oil Monitoring Analyst Level I (OMA) and Certified Lubrication Specialist (CLS), which further increased their confidence and ownership of the process (Figure 2). They then began implementing what they learned into their operations.

Reliability Products

One of the first changes made was installing desiccant breathers and sight glasses on many of the assets (Figure 3). Top-down support was crucial for this investment to happen. It was understood and agreed upon that increasing the reliability of each asset would lower the total cost of ownership. LE later incorporated other reliability products, including automatic lubricators and filtration devices.


Computer System

As the workforce’s knowledge level increased and reliability improved due to the small changes put in place, improvements began to accelerate. LE began looking into a computerized maintenance management system (CMMS) because, up to this point, maintenance reliability technicians were working from computer-generated asset cards to do lubrication activities. Maintaining this archaic system was not easy.
During its review of several CMMS packages, LE realized that a CMMS would be more time-consuming to implement than a simple computerized lube route system. At the time, the main goal was to quickly get a better handle on lubrication reliability practices, however, many of the CMMS packages reviewed did not incorporate lubrication, or their lubrication components would have been cumbersome to implement. After many discussions, LE came to the conclusion that adopting a CMMS system did not make sense at that time for its five person, one shift maintenance department. Having made this decision, LE was able to proceed more rapidly with the rest of its journey.

Plant Survey

LE’s mechanical assets include 177 gearboxes and gear reducers, 119 electric motors, 51 pumps and 21 stirring vessels, as well as compressors and additional miscellaneous equipment. The entire facility was surveyed and each lubrication point on each asset was identified. This helped the facility visualize the amount and type of equipment it was performing maintenance on and gave it a blueprint to start managing the equipment more efficiently. This is a critical step in the process and should not be skipped.

Lube Room

Lubricants are the lifeblood of mechanical assets throughout any facility. LE regards them as assets, not consumables. In fact, LE looks at lubricants as its number one asset. Just like any other asset, lubricants need to be maintained properly and used properly for specific applications. A well-equipped lube room will protect these fluid assets so you can sleep at night.

LE purchased a new lubrication storage system and created a dedicated lube room (Figure 4). This made it evident to all employees that the company was serious about reliability. The maintenance team took ownership of this new lube room and storage system, and they are very proud of it.


This created momentum in the lubrication reliability journey, which became increasingly evident as the maintenance team began to think of more ways to improve machine uptime.

Lubricant Identification

All lube points were tagged according to product number and color-coding that matched the storage system tanks was implemented. This helped make lubrication a smarter, more streamlined process for the team and it raised the knowledge level of each team member.

Lube Route Software

After a search of available software solutions, LE purchased lubrication reliability software to manage all its lube tasks. The quick turnover to this system enabled LE to keep its mechanical assets running and minimize downtime. With the software, LE was able to assign lubrication routes and schedules to team members who took ownership of the process to ensure “their” equipment was maintained properly.

The software significantly improved LE’s ability to manage the lubrication of its mechanical assets and helped the facility organize its approach to handling maintenance activity.

Results

By implementing all these steps on its reliability journey, LE has seen a major reduction in the cost of equipment repairs and maintenance. From 2006 to 2008, LE documented an annual average expenditure of $243,000. In 2009, the first full year after lubrication reliability changes, this annual number dropped dramatically to $83,000. LE spent an average of $76,000 annually in the five years since the program was implemented on repairs and maintenance of equipment (Figure 5).

Using condition-based monitoring and oil analysis, LE also drastically decreased its oil usage. From 2008 to 2013, annual lubricant usage dropped from 449 gallons to 67 gallons, for a savings of more than $11,000.

Reducing lube change-outs, as well as repair and maintenance tasks, contributed to significant labor savings. In 2008, 672 hours of labor were dedicated to maintenance and repair tasks; in 2013, that dropped to 120, for a savings of nearly $10,000 (Figure 6).

Looking back, the main drivers that helped LE on this journey were:

  • Supportive top-down leadership;
  • Willingness to invest equally in both people and mechanical assets;
  • Detailed plan of attack;
  • Patience (organizational stamina);
  • Quantification of results.

With similar drivers in place, your organization can achieve the same positive results. The most important thing to do is take that first step and get started. Soon, you will be on your way to finding the hidden plant within your facility.


Darren Booth, CLS and vice president of Manufacturing Operations, has worked for Lubrication Engineers, Inc. for 25 years. Darren currently oversees plant operations, consisting of manufacturing, product handling, traffic and maintenance. Through his role in helping implement lubrication reliability throughout the operation, he has been a catalyst in lowering LE’s total cost of ownership of its mechanical assets.

Thursday, 27 October 2016

Project life cycle support using RAM analysis

Article extract from DNV GL blog, part of ReliablePlant newsletter:
http://blogs.dnvgl.com/software/2014/11/project-life-cycle-support-using-ram-analysis/

RAM (Reliability, Availability and Maintainability) analysis are commonly used to support the decision making process. The analysis can be used throughout the project life cycle to support the decisions that have to be made at each of the various stages:


Project lifecycle

Conceptual Design
The Conceptual Design is a preliminary stage where a description of the proposed system in terms of a set of integrated ideas and concepts are made. The result is the generation of many Design Concepts which are supported to  evaluate the feasibility of each conceptual alternative. Advanced RAM analysis allows quick screening of various development options to assess suitability (from a functional & commercial perspective) of the proposed designs.

Front End Engineering Design stage
Once a number of options have been selected, a more detailed analysis can be carried out to choose major equipment types and maintenance philosophies. At this stage, the most important decisions in regards to concept and plans for the project are made. Some of the questions that you might want to answer at this stage are:

  • How does equipment/unit reliability impact production?
  • What happens if equipment performance is worse than expected?
  • What size storage tanks (equipment) should I have?
  • What is the impact of unit over-design (catch-up) margins?
  • What is the optimum unit configuration in order to maximise production/availability and maintenance reduction?
  • Will it be possible to meet the customers’ demands for products?
  • What is supply efficiency to each customer?

Advanced RAM analysis helps you to decide what is the best configuration for your assets and aids you in answering these and many more questions.

Detailed engineering
The Front End Engineering Design (FEED) stage leads to the creation of primary design documents such as process flow diagrams (PFDs), Process & Instrumentation Diagrams (P&IDs), equipment lists and equipment datasheets. Once the FEED has been finalised, a much more detailed design for the system is specified. At this stage, the questions are much more specific:

  • What happens if I improve equipment reliability?
  • What is the financial impact of investing in more reliable equipment?
  • Should I spare equipment to increase reliability?
  • How many spares do I need to have and how would it increase system reliability?

Advanced RAM analysis ensure that the system design meets your required performance targets.
Execute

By identifying the critical elements and the bottlenecks in the system, the results from an Advanced RAM study can be used to feed in to other methodologies, such as Risk Based Inspection (RBI) and Reliability Centred Maintenance (RCM). Subsequently, the output from the RBI and RCM processcan then be fed back into the model to provide a final picture of system performance.

Operational Stage
During the Operational phase, it is not very cost-effective to make decisions in regards to the design. However, Advanced RAM analysis can also be used to assess impact of planned modifications. The most common evaluation carried out during the Operational stage is related to the maintenance philosophy which, basically, refers to number of spares, re-stock time and available personnel. There is always a trade-off between the cost of lost production versus the cost of maintenance.

Rejuvenate
For mature systems, as we keep asking more of our ageing assets, the Advanced RAM methodology allows you to find potential areas for rejuvenation or facilities life extension. Many sensitivity cases can be applied to a mature system model, which will indicate to various rejuvenation options and the potential gains quantified.

A platform at the end of its lifecycle must be assessed to extend their production. Many parameters must be evaluated:
  • Ageing systems and old technology – what is critical when it comes to production loss?
  • Decommission of problematic systems – which system should be turned off?
  • Where should I focus main preventive maintenance?

Decommission
Sometimes, due the high number of variables in an oil and gas development, it is not easy to identify at where the operational expenditure exceeds the revenue, making the system no longer economically viable. By modelling all the transient behaviours of a system, Advanced RAM analysis helps you to  evaluate decommissioning strategies viability.

Tuesday, 25 October 2016

Improving Maintenance in the New Year

Article extract from ReliablePlant newsletter:
http://www.reliableplant.com/Read/29212/improving-maintenance-new-year

Let's assume you have an average plant and the economy is tight. You can't travel, and you must save money. What should your New Year's resolution be? Here are some suggestions:

1) If you are going to cut maintenance cost, you cannot focus on cost itself but rather on what drives cost. Perhaps use an analogy in safety. You can't just send out a memo or shout "improve safety." You need to fundamentally change the way people behave. Another analogy is energy cost. How would you reduce energy cost? You have to focus on things that save energy and drive that cost such as leaks, insulation, etc. When it comes to maintenance cost, often it is just slashed without considering the effects of that cost cutting. Again, focus on what drives maintenance cost, not the cost itself.

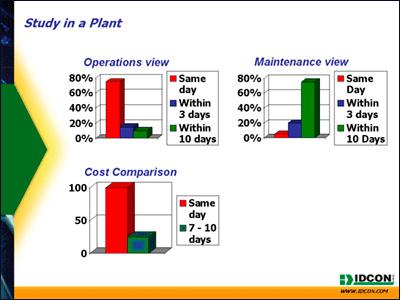
2) Get a common understanding between operations and maintenance on what constitutes good maintenance. I recently worked in a plant that has tried for years to improve reliability. However, when asked what constitutes good maintenance, operations answered that "75 percent of the work is executed the same day," while maintenance answered that "good maintenance is when 4 percent of the work is executed the same day." Plant personnel must sit down and define "what good looks like." Otherwise, you will never be able to drive improvement in the right direction.

3) Only request maintenance jobs to be done today or tomorrow if it is absolutely necessary. This is a principle that makes sense and that most people understand, but few actually do. It is the classic know-do gap. It is also often triggered by not trusting the maintenance department. If it is not submitted as an emergency, it will not be done. In the past, people have started to scream louder and louder to get jobs done. Eventually, everybody is screaming. Managers must take charge and enforce a meaningful priority system.

4) Inspect equipment with detailed look, listen, smell, feel inspections together with a minimum of an infrared gun, flashlight and a stroboscope. There is no way you can plan for next week if you don’t know what is about to break down. Many plants are in a catch-22. "There is no time to do inspections because we have too many breakdowns" is something I hear several times a month. Management has to take charge and break out of this cycle. It will initially cost some additional time that will be saved in both maintenance cost and uptime later. There's no magic formula. It's very simple. Collect the tools, find a craftsperson who is highly skilled and willing to do the inspections, and get going. Detailed documentation is necessary at some point, but it is more important to begin the process.

The above is a good list to start on for the average plant. Most plants do some of this already; however, they just need to improve. There is no capital cost — just the cost for doing repairs that must be done anyway earlier and cheaper.

Using ‘Unscheduled’ Oil Analysis for Early Predictive Maintenance

Article extract from ReliablePlant newsletter:
http://www.machinerylubrication.com/Read/29398/unscheduled-oil-analysis

Most oil samples are taken based on a fixed schedule. For large, stationary rotating equipment, monthly or bi-monthly samples are common. Proactive maintenance programs depend on regular checks for oil cleanliness, dryness and lubricant quality. However, machines can and do fail for a variety of reasons, and there is a certain randomness to the onset of these failures. Furthermore, the failure development period is equally unpredictable, with some failures taking months to develop, while others are sudden and abrupt.

In the March-April 2013 issue of Machinery Lubrication, I addressed machine criticality analysis as an essential tool to define the Optimum Reference State (ORS) for numerous lubrication and oil analysis activities. The Overall Criticality Matrix (OCM) is constructed from two assessments: the Machine Criticality Factor (MCF) and the Failure Occurrence Factor (FOF). The MCF relates to the consequences of machine failure while the FOF relates to the probability of machine failure. Both the MCF and the FOF are highly influenced by the effectiveness of “early fault detection.” In other words, the effectiveness of early fault detection sharply reduces machine criticality (for details on this, read the article atwww.machinerylubrication.com/Read/29346/machinery-criticality-analysis).


Figure 1. Early Predictive Maintenance P-F Interval Scheme
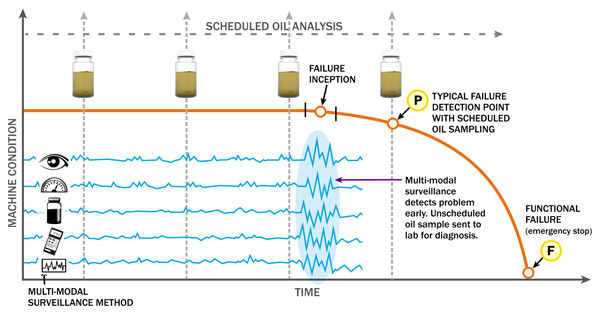
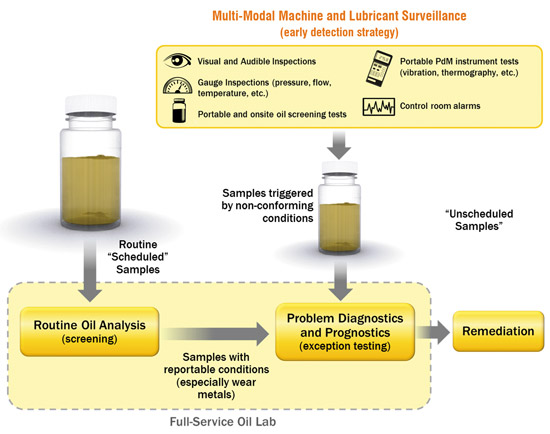
This is the critical link to the “unscheduled” oil analysis strategy. Its theme is not just predictive maintenance (PdM), but more specifically, early predictive maintenance (EPM). Let’s start by reviewing the widely used P-F interval. A modified version is shown in Figure 1.

The “P” is the point when an abnormal wear condition or fault is first detected. The “F” is the functional or operational end of the failure cycle requiring repair or replacement. Failures with short development periods usually go undetected when tests (e.g., vibration and oil analysis) are performed infrequently (even monthly analysis is viewed as infrequent). Conversely, frequent detection methods not only can report a developing failure but also have the potential to detect that failure early (in the incipient stage). There are specific tactics and tools for doing this well.

Again, the secret to this strategy is the frequency. It enables a much higher percentage of failure detection (saves) events, especially earlier detection. The purposeful benefit is mitigated machine damage and reduced or no unscheduled downtime (longer P-F interval). While PdM concentrates on predicting the end of a machine’s (or lubricant’s) service life, EPM puts critical focus on timing - not just detecting - by detecting early. It seeks a budding problem, not a burgeoning problem.

Detection by Multi-Modal Surveillance

In Noria’s seminars, we use the expression, “You can’t catch a fish unless your hook is in the water.” Likewise, in oil analysis, you can’t catch a fault unless your hook is in the water. There’s an earlier tier to oil analysis called the “detection phase,” which in my view is a huge untapped opportunity in condition-based maintenance. Most scheduled oil analysis programs skip over the detection phase by attempting to catch impending machine failures and only take infrequent snapshots of oil condition.


Figure 2. Combining lab data with surveillance data for a complete picture of machine condition
The detection phase of EPM is continuous failure surveillance across numerous parameters. It integrates skillful and frequent human inspection tactics with other conventional monitoring technologies. A few years ago, I wrote a column on the power of the one-minute daily inspection. This is a critical and often underutilized modality of surveillance and detection.

Fundamentally, the detection phase of EPM is anything and everything that can be done to detect (not analyze) failure in progress. It includes all of the following:

  • Daily routine visual inspections of the oil (level, color, opacity, foam, varnish, tank condition, leakage, magnetic plugs, etc.)
  • Audible inspections (change in machine sound)
  • Temperature inspections (touch, heat guns, gauges, etc.)
  • Portable PdM technology inspections (vibration overalls, thermography, acoustics, motor current, etc.)
  • Mechanical inspections (shaft movement, seal conditions, open gear wear, etc.)
  • Instrument and gauge inspections (flow rates, proximity probes, pressure, bypass indicators, etc.)
  • Onsite oil analysis screening tests (crackle, blotter, viscosity, ferrous density, patch, etc.)

Many impending and precipitous failure conditions that were first reported by scheduled oil analysis could have been detected much earlier if better and more frequent inspection methods were in place, such as those in the list above. The economics of early detection are enormously improved as well.

As noted previously, failure detection and failure analysis are different concepts. Once an abnormal condition has been detected, it can be investigated further to determine where it is coming from, the probable cause of the failure, how severe and threatening it is, and the corrective action. This is where oil analysis and other predictive technologies can be very valuable. “Unscheduled” oil samples can then be forwarded to the lab for troubleshooting purposes (diagnostics and prognostics). These include samples from secondary sampling ports to help localize the source of the problem.

In the laboratory, specialized qualitative and quantitative tests can be performed to characterize the nature of the condition. These might include wear particle identification (XRF, SEM-EDX, analytical ferrography and many others). The skills of a triboanalyst and a multi-technology PdM specialist can combine lab data with surveillance data for the most complete picture of the machine’s condition (see Figure 2).

Proactive Maintenance Still Requires Scheduled Oil Analysis

Unscheduled oil analysis is not an alternative to scheduled oil sampling and analysis. Routine oil analysis is still needed for many reasons. The most important is proactive maintenance, which uses oil analysis to monitor and control the presence of failure root causes. These include verification of the lubricant’s physical and chemical properties as well as contamination control. The benefits of a fine-tuned proactive maintenance program are much slower machine wear rates (longer machine service life), fewer overall machine failures and less associated downtime.

When proactive maintenance is combined with EPM, a comprehensive and more efficient condition-based maintenance program results. Early predictive maintenance is about extreme vigilance. It involves the development of more effective inspection skills and a more effective means of inspection (machine modifications). It also requires a culture change and management support for remediation of machines that have not yet failed.


About the Author
Jim Fitch Photo
Jim Fitch, a founder and CEO of Noria Corporation, has a wealth of experience in lubrication, oil analysis, and machinery failure investigations. He has advised hundreds of companies on developing ... 

Thursday, 20 October 2016

How to Modernize Maintenance Processes

Article extract from ReliablePlant newsletter:
http://www.reliableplant.com/Read/29240/cmms-iso-certification

It's one thing to claim customer satisfaction in marketing literature and Web content. It's another to achieve it by precisely measuring customer specifications and winning ISO 9000 certification.

Midland Metal Products (MMP) designs and fabricates permanent advertising display fixtures using sheet metal, wire and tubing for a vast array of consumer goods and products. As a fourth-generation supplier, MMP noticed that many of its processes had simply grown with the business. While going through certification audits, it became clear that the company needed to modernize its maintenance management process. Part of that certification process was to implement a computerized maintenance management system (CMMS).

Measurements Count

Because MMP builds advertising displays for ad agencies that serve hundreds of consumer retail brands, it receives specifications from ad agencies to fabricate displays from scratch.

"Because we do custom displays, we're bringing to life fabrications that haven't existed before," said B.J. McDonald, MMP's co-owner and facility director. "Erroneous measures can ruin the display. Therefore, our measuring tools have to give precise measurements."

To meet ISO standards, all 242 of MMP's measuring tools — from tape measurers to micrometers — must be calibrated precisely to the customer's measurement parameters.  

"The ISO 9001-2008 certification helped us look at our production system and come up with a precise process to do this one thing perfectly all the time – from the moment you get the customer order to the end product the customer receives," McDonald explained.

Because of the close tolerances for MMP's custom products, calibrating measurement devices was a major issue. 

"As part of our certification, ISO auditors looked at whether our measurement devices could fail," McDonald said. "Bigfoot CMMS helped us win ISO certification."

Before MMP installed its CMMS, the company had no way to adequately track or maintain any of its measurement devices. Today, MMP uses CMMS to schedule preventive maintenance (PM) for every measurement device used in the plant.

In addition, by employing CMMS to issue daily PMs, MMP shows ISO auditors and customers that the company is working within the tolerances of its market. According to ISO standards, each device must have a certificate of calibration to get the designation. This is one area where the company simply cannot miss a PM.

Maintenance Matters

MMP not only uses CMMS for measurement devices but also for its entire plant. Within its 110,000-square-foot facility, there are 138 pieces of production machinery equipment, such as turret presses, laser cutters, press brakes and resistance welders. This also includes a total of 2,100 assets from air and power tools to facility equipment, stationary power tools, personal-protection equipment, material handling and even janitorial supplies. However, of the 165 employees, only three are on its maintenance staff. Before CMMS was implemented, McDonald described the maintenance process as "a verbal and casual method of maintenance, responding to the loudest shout."

"We had no time to put a preventive maintenance program in place," he noted. "That also meant noncritical repairs sometimes got fixed before critical requests that were truly important to the operation. So downtime was a problem, too."

While implementing the two programs seemed like a big task, the initial prep work was worth it.

"The ISO preparation can seem, at times, as if it's adding complexity, but the end result is a streamlined system with increased efficiency across the board," McDonald added. "We get a similar result from our Bigfoot CMMS system. We had to asset-number every piece of equipment we use, down to tape measurers and air-conditioning units. Anything that needs maintenance, replacement, inspection, cleaning and calibration now has maintenance scheduled on Bigfoot CMMS."

MMP also uses CMMS for work orders, repair requests and PM scheduling. Its team generates about 2,400 work orders for PMs a year. This has allowed the company to reduce unforeseen repairs to about 20 percent of its previous workload.

PM Efficiencies Boost Uptime

With 15 seats to serve each department and a hierarchy of requestors, MMP has eliminated interruptions from ad-hoc requests. Now, the maintenance staff is more efficient.

"Once the PM calendar was set up, we were able to increase maintenance department productivity by being better able to distribute PMs more evenly," McDonald said.

The CMMS prioritizes high-value machine PMs so MMP can stay ahead of breakdowns. This is where the biggest improvement has been seen.

"With our PM program, we now average 99.6 percent uptime on our production equipment," McDonald noted.