http://www.machinerylubrication.com/Read/28978/analyzing-gear-failures
Best Practices for Analyzing Gear Failures
With all the different gearbox failure modes, it’s important to be aware of the various tests that can be used to develop and confirm a hypothesis for the probable cause of failure. Lubricant samples can provide immediate means to detect contamination or other adverse changes to the lubricant. These samples can be sent to a laboratory for further analyses. There are also a number of tests that can be performed on-site and at a low cost to check for lubricant contamination or oxidation.
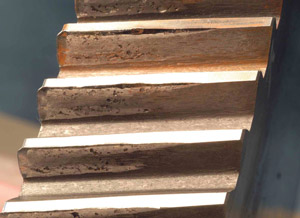
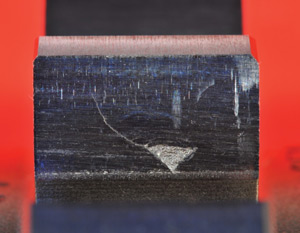
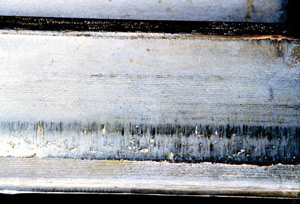
This image shows how severe misalignment
can limit the contact area and cause macropitting.
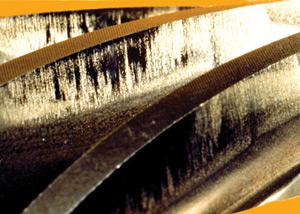
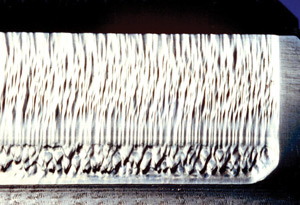
Micropitting often will have a pattern that indicates misalignment.
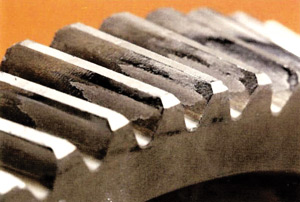
A lubricant with inadequate anti-scuff additives caused scuffing on this spiral bevel pinion.
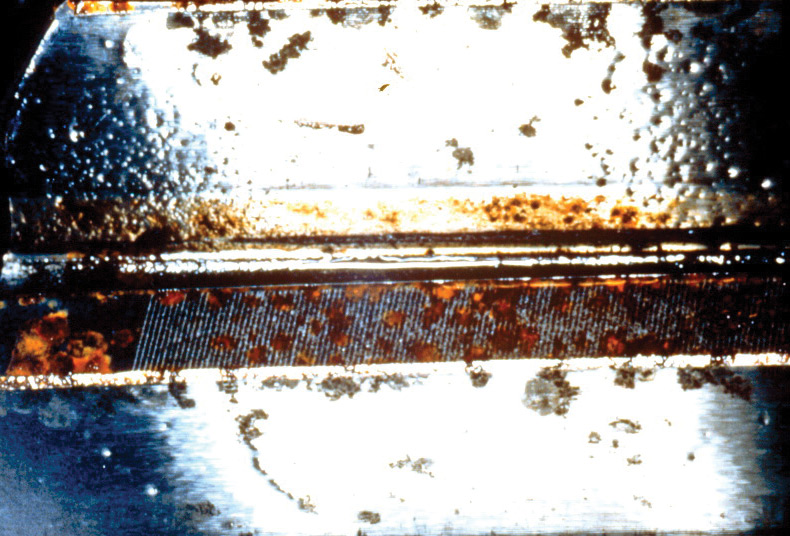
A lubricant contaminated with water produced corrosion on this helical gear.
There are many possible causes for an increase or decrease in viscosity. For example, some oils have additives known as viscosity-index (VI) improvers that might not be shear stable. With time in service, these oils lose viscosity because the VI improvers shear down.
In addition, overheating might cause oxidation. Contamination by water and wear debris accelerates oxidation. The following symptoms are indicative of oxidation:
Other test methods used to monitor abnormal wear of gearboxes include ferrous density, particle counting (ASTM D7647) and analytical ferrography (ASTM D7690).
Direct reading (DR) ferrography is a ferrous density test that measures the amount of ferrous wear debris in an oil sample. The results of DR ferrography are generally given in terms of DL for particles greater than 5 microns and DS for particles less than 5 microns in size.
Analytical ferrography allows wear particles to be observed by the analyst via microscopic analysis. In this evaluation, active machine wear as well as multiple different modes of wear can be determined. This method has an outstanding sensitivity for larger particles.
Particle counting in industrial gearboxes tells the same story as particle counting in a hydraulic system or pump application - that of cleanliness. When establishing an oil analysis program that is proactive in controlling contamination, particle counting is a vital component to the routine test slate.
This is an example of point-surface-origin
(PSO) macropitting caused by tip-to-root interference.
In this example, abrasion and scuffing
have been caused by tip-to-root interference.
The equipment needed for proper draining and sampling includes:
A lubricant contaminated by sand
resulted in abrasion on this spur pinion.
When all the calculations and tests are completed, form one or more hypotheses for the probable cause of failure and then determine if the evidence supports or disproves the hypotheses. While similar procedures apply to any failure analysis, the specific approach can vary depending on the nature of the failure and time constraints.
So whether you perform tests on-site or send oil samples to a laboratory for further analysis, be sure to select the appropriate test to help you correctly determine the probable cause of a failed gearbox.
Appearance Test
The simplest test is visual appearance. Often this test will disclose problems such as gross contamination or oxidation. Look at the lubricant in a clean, clear bottle. A tall, narrow vessel is best. Compare the sample to a sample of new, unused lubricant. The oil should look clear and bright. If the sample looks hazy or cloudy, or has a milky appearance, there might be water present. The color should be similar to the new oil sample. A darkened color might indicate oxidation or contamination with fine wear particles. Tilt the bottle and observe whether the used oil appears more or less viscous than the new oil. A change in viscosity might indicate oxidation or contamination. Look for sediment at the bottom of the bottle. If any is present, run a sedimentation test.Sedimentation Test
If any sediment is visible during the appearance test, a simple test for contamination can be performed on-site. Place a sample of oil in a clean, white cup made from a non-porous material that is compatible with the lubricant. Cover and allow it to stand for two days. Carefully pour off all but a few milliliters of oil. If any particles are visible at the bottom of the cup, contaminants are present. Resolution of the unaided eye is about 40 microns. If the particles respond to a magnet under the cup, iron or magnetite wear fragments are present. If they don’t respond to the magnet and feel gritty between the fingers, they are probably sand. If another liquid phase is visible or the oil appears milky, water is likely present.This image shows how severe misalignment
can limit the contact area and cause macropitting.
Odor Test
Carefully sniff the oil sample. Compare the smell of the used oil sample with that of new oil. The used sample should smell the same as new oil. Oils that have oxidized have a “burnt” odor or smell acrid, sour or pungent.Crackle Test
If the presence of water is suspected in an oil sample, a simple on-site test can be performed. Place a small drop of oil onto a hot plate at 135 degrees C. If the sample bubbles, water is above 0.05 percent. If the sample bubbles and crackles, water is above 0.1 percent. When carrying out the crackle test, the inspector’s health and safety must be taken into consideration by wearing eye protection, for example.Why Take Oil Samples from a Failed Gearbox?
Laboratory analysis of oil samples from a failed gearbox might answer the following questions:- Does the oil meet the original equipment manufacturer (OEM) specification?
- Was the oil contaminated?
- Was the oil degraded?
- Does the oil contain evidence useful for finding the root cause of failure?
- Is the oil representative of the service oil?
| 45% | of lubrication professionals consider the appearance test to be the most effective on-site test to check for lubricant contamination or oxidation, according to a recent survey at machinerylubrication.com |
Does the Oil Meet the OEM’s Specification?
Sometimes a gearbox fails because the wrong oil was used. To prove whether the oil meets the OEM’s specification, the following laboratory tests should be performed on used oil samples and compared to laboratory test results from samples of fresh, unused oil that conforms to the OEM’s specification:- Viscosity at 40 degrees C and 100 degrees C (ASTM D445)
- Spectrometric analysis to determine elements in the oil (ASTM D5185 or D6595)
- Acid number (ASTM D664 or D974)
- Infrared spectroscopy to determine additive content (ASTM D7412, etc.)
Micropitting often will have a pattern that indicates misalignment.
A lubricant with inadequate anti-scuff additives caused scuffing on this spiral bevel pinion.
Was the Oil Contaminated?
The fatigue life of gears and bearings is adversely affected by water. For example, as little as 50 ppm of water reduces rolling bearing fatigue life by 75 percent. Therefore, the Karl Fischer titration method (ASTM D6304) should be used to determine the water content. Other laboratory tests such as viscosity, spectrometric analysis and infrared analysis can help determine if other fluids such as the wrong oil, flushing oil or coolant contaminated the service oil. Spectrometric analysis might disclose contamination via environmental dust by showing high concentrations of silicon and aluminum.A lubricant contaminated with water produced corrosion on this helical gear.
Was the Oil Degraded?
The oil might lose its ability to lubricate if its viscosity changes significantly or if it is oxidized. The manufacturing tolerance on viscosity is plus or minus 10 percent. Therefore, ISO VG 320 oil should have a viscosity that falls within the range of 288 to 352 centistokes at 40 degrees C.There are many possible causes for an increase or decrease in viscosity. For example, some oils have additives known as viscosity-index (VI) improvers that might not be shear stable. With time in service, these oils lose viscosity because the VI improvers shear down.
In addition, overheating might cause oxidation. Contamination by water and wear debris accelerates oxidation. The following symptoms are indicative of oxidation:
- A foul odor (sour, pungent or acrid smell)
- A dark color
- An increase in viscosity
- An increase in the acid number
- A shift in the infrared spectrum
Does the Oil Contain Evidence for Finding the Root Cause of Failure?
Wear debris in the oil may help indicate failure modes that occurred in the gearbox and reveal contaminants that contributed to the failure. Spectrometric analysis can uncover contamination via environmental dust by showing high concentrations of silicon and aluminum. These results might explain abrasion on gear teeth and bearing surfaces. Depletion of anti-scuff additives may confirm a scuffing failure, and excessive water concentration might explain corrosion.Other test methods used to monitor abnormal wear of gearboxes include ferrous density, particle counting (ASTM D7647) and analytical ferrography (ASTM D7690).
Direct reading (DR) ferrography is a ferrous density test that measures the amount of ferrous wear debris in an oil sample. The results of DR ferrography are generally given in terms of DL for particles greater than 5 microns and DS for particles less than 5 microns in size.
Analytical ferrography allows wear particles to be observed by the analyst via microscopic analysis. In this evaluation, active machine wear as well as multiple different modes of wear can be determined. This method has an outstanding sensitivity for larger particles.
Particle counting in industrial gearboxes tells the same story as particle counting in a hydraulic system or pump application - that of cleanliness. When establishing an oil analysis program that is proactive in controlling contamination, particle counting is a vital component to the routine test slate.
This is an example of point-surface-origin
(PSO) macropitting caused by tip-to-root interference.
In this example, abrasion and scuffing
have been caused by tip-to-root interference.
Is the Oil Representative of the Service Oil?
If the oil appears very clean, it might have been changed after the failure occurred. Therefore, check maintenance records and interview maintenance personnel to determine whether the oil is representative of the oil that was in service when the failure took place.Sampling Procedures during an Oil Drain
Always use clean, lubricant-compatible plastic or glass sample bottles and caps, and keep all sampling equipment thoroughly clean. Prior to sampling, fill out the label and attach it to the sample bottle. Be sure to record the sample point and the date.The equipment needed for proper draining and sampling includes:
- Clean containers for holding the drain oil
- A wire-mesh screen
- Four or more clean laboratory bottles (clear plastic) for taking samples
- A large bottle for capturing excess water
First Oil Sample
Drain the oil through the screen to capture any large wear debris or fracture fragments that might be entrained in the drain oil. Take the first oil sample at the start of the drain. Be prepared to capture any free water that may have settled in the gearbox. If there is a large quantity of water, fill a sample bottle and then capture the remaining water in the large bottle. Once the water stops flowing, take a sample of the oil.A lubricant contaminated by sand
resulted in abrasion on this spur pinion.
Second Oil Sample
Take the second oil sample near the middle of the drain. Estimate the oil level in the gearbox from the sight gauge or from direct measurements. This sample will be used to determine bulk oil properties that are more representative of the in-service oil properties.Third Oil Sample
Take the third oil sample near the end of the drain. This sample might capture less dense contaminant fluids.When all the calculations and tests are completed, form one or more hypotheses for the probable cause of failure and then determine if the evidence supports or disproves the hypotheses. While similar procedures apply to any failure analysis, the specific approach can vary depending on the nature of the failure and time constraints.
So whether you perform tests on-site or send oil samples to a laboratory for further analysis, be sure to select the appropriate test to help you correctly determine the probable cause of a failed gearbox.