Showing posts with label Tribology. Show all posts

Thursday, 27 October 2016

Lubrication FMEA: The Big Picture

Article extract from ReliabilityWeb:
http://reliabilityweb.com/articles/entry/lubrication_fmea_the_big_picture/

The global failure modes are:
  • Obsolescence (10%)
  • Breakage (10%)
  • Surface degradation (80%)

The surface degradation causes are:
  • Corrosion - Why we paint and use protective coatings
  • Wear - Why we lubricate
  • Adhesive wear
  • Abrasive wear
  • Surface fatigue
  • Corrosive wear
Obsolescence at 10 percent appears to be growing with rapidly changing technology and increasing government regulations. Do you remember the U.S. government's Cash for Clunkers program? If you operate a coal fired power plant, can you see obsolescence on the horizon?

Breakage, also at 10 percent, is for the design engineers to use FMEA to determine how to handle today's increasing power densities and lighter weights while improving reliability in future process systems and equipment.

Surface degradation at 80 percent is further divided into wear at 65 percent and corrosion at 15 percent. With respect to lubrication, corrosion can be eliminated at this level because paint and protective coatings or stainless steel and other corrosion resistant alloys are used to protect equipment surfaces against environmental damage.

By eliminating 35 percent of the global failure modes, a Tribologist or lubrication engineer can focus on wear when using FMEA. If you don't have a lubrication engineer on your FMEA team, get one! Many organizations do not have an engineer with any formal training in lubrication or tribology - the study and application of the principles of friction, lubrication and wear.


Adhesive Wear

Adhesive wear is a direct result of metal to metal contact. Surface asperities contacting under load while sliding will generate heat, friction and wear due to insufficient or loss of the lubricating film. The range of adhesive wear can be as low as running-in wear with a poorly specified break-in oil up to catastrophic damage with surfaces welded together due to total loss of lubrication.

The most important physical property of a lubricating fluid is viscosity. Viscosity measures a fluid's resistance to flow as it relates to load, temperature and speed. Viscosity determines the ability of the lubricant to enter the contact zone of the moving surfaces and remain in the contact zone under the applied load for the necessary time to prevent metal to metal contact.

Today's equipment design engineers now see the lubricant as an integral component to improve reliability. That is why it is important to read the original equipment manufacturer's manual and review the recommended oils and greases. However, when an existing process or machine is being applied in a new way, any change to the operating load, temperature, or speed must be analyzed to maintain the proper oil film.


Abrasive Wear

While the saying, "cleanliness is next to godliness," does not appear verbatim in the Bible, it certainly needs to be a commandment for proper lubrication practices. Abrasive wear is caused by suspended hard particles in lubricants. These particles are a combination of wear particles generated by adhesive wear, dirt and other abrasive particles from the process or environment and, in some cases, from the degradation of the lubricant itself. Abrasive wear is why we use filtration and seals.

Never assume a new hydraulic system or piece of machinery is clean and never assume a new lubricant is clean. New machinery and systems must be flushed to remove contaminants that entered during manufacturing and assembly. If you want clean new lubricants, then you must specify the International Organization for Standardization's (ISO) cleanliness requirements for new lubricants and even then, use filtration to transfer the new lube from its container into the reservoir or sump.

Using dirty lubricants affects the entire system or machine because abrasive particles circulate throughout until they are filtered or settle in the reservoir.


Surface Fatigue

Machinery components do not last forever; they have a designed life for their useful purposes. Premature surface fatigue is usually the result of over-speed or overload of the equipment, especially in the case of bearings and gear surfaces. Even in a perfectly lubricated bearing, if you double the speed, bearing life is reduced by 50 percent and if you double the load, the life is reduced by 87.5 percent.

We are a nation of tinkers and profit-driven to increase system production by making things faster (speed) or doing more work (load) in the same amount of time. By our own actions, surface fatigue has a dotted line impact on why equipment breaks.

Surface fatigue is extremely difficult to detect in operating systems because it is easily masked by catastrophic adhesive wear or catastrophic abrasive wear caused by large chunk spalling. Detection in operating equipment is difficult and typically requires partial disassembly and bore scoping by a trained technician, or direct reading ferrographic analysis of wear particles. In many cases, surface fatigue is only confirmed by complete machine disassembly and inspection of the failed component using magnetic, X-ray, ultrasonic, or scanning electron microscope devices.


Corrosive Wear

Over time, oxidation causes lubricants to become acidic. Acidic lubricants are responsible for most surface corrosion. This can be measured by the increase in the total acid number (TAN) of the used oil compared to the new lubricant's referenced TAN. In most cases, if the used oil TAN number is 2.5 higher than the new oil's referenced TAN, then the used oil is sufficiently acidic to cause surface corrosion. Oxidation reactions with the lubricant also cause internal deposits of gums, varnish and sludge. Surface corrosion caused by additive reaction is rare. It is generally found in additive reactions with copper or silver surfaces. This is easily detected using elemental oil analysis.

In conclusion, by adding the above risk priority numbers (RPNs) in Figures 2-5, the sum is 65.005% representing the global percentage of equipment failure modes caused by surface degradation. The best way to reduce this global failure mode percentage in your processes and equipment is to improve your lubrication program.

The lubrication program should emphasize the selection of lubricants that must be application driven based on the load, environment, temperature and speed of the process. The lubrication program also must ensure the five basic rights of machinery, which are the right lubricant of the right quality delivered in the right place at the right time in the right amount. Formal lubrication training is needed to establish a truly effective lubrication program. Most organizations require a cultural change in the way they view lubrication fundamentals.


John Cummins is vice president of product technology at Hydrotex®, a manufacturer and distributor of high performance lubricant and fuel improver solutions. He is the Dean of Hydrotex Lubrication University, a comprehensive lubrication education program for the sales field and Hydrotex customers. He is a certified lubrication specialist by the Society of Tribologists and Lubrication Engineers (STLE). www.hydrotexlube.com

Thursday, 21 July 2016

Avoiding Common Gearbox Lubrication Problems

Article extracted from Machinery Lubrication newsletter:
http://www.machinerylubrication.com/Read/29404/gearbox-lubrication-problems

The right-angle worm gearbox is a simple device that is used widely in manufacturing facilities. Like nearly all gears, enclosed worm gear drives require proper lubrication in the appropriate amounts. It is these two factors — lack of lubrication and the use of incorrect lubrication — that are the most common causes of premature failures in worm gearboxes.

Lack of Lubrication

Operating a worm gearbox dry (without lubrication) frequently leads to failure of the unit. Manufacturers often ship gearboxes dry for a couple of reasons. First, the added weight of the lubricant adds to shipping costs, and that weight can be significant in larger gearboxes. Secondly, numerous manufacturing facilities have standardized on a specific lubrication supplier, and while many lubricants are interchangeable, they should not be mixed. Shipping a unit dry allows the end users to ensure commonality within their facility.


These bronze gear shavings resulted
from a gearbox that was run dry.

Unfortunately, a novice installer may ignore or neglect to read the tags, labels and installation manual warnings that indicate there is no lubrication and start up a drivetrain with a gearbox that is without lubrication. Running a unit dry will rapidly cause damage to the bronze worm gear. Even if lubrication is added after the fact, this damage is permanent, and the gearbox will need to be replaced or rebuilt. There is no way to “heal” a damaged gear.

Not Enough Lubricant

A related failure occurs when there is too little lubrication. This can often be the result of the gearbox mounting. The most common mounting for a worm gearbox is referred to as “worm over,” which means the worm rests above the bronze gear. In worm-over orientation, a gearbox needs a set level of lubricant. However, this same gearbox assembly can be mounted in the worm-under orientation, which requires additional lubrication.


A gearbox mounted in the worm-under orientation requires additional lubrication.
The gearbox construction and the manner in which lubrication moves with the gears can be such that a unit with worm-under mounting may require as much as 50 percent more lubrication than a unit with worm-over mounting. Failure to increase the amount of lubrication will mean that the bearings on the output shaft will run dry and fail in a relatively short period of time.

For any given gearbox, there is no physical reason a unit may not be mounted in the worm-over or worm-under orientation so long as proper lubrication levels are maintained. One of the problems that results from insufficient lubrication is that failure is not immediate. The unit will perform well for a time, perhaps a few weeks or a month, depending upon the application. As a result, a technician may not make the connection between too little lubricant and the unit failure, and may repeat the error.


These bronze gear teeth have been worn smooth after
prolonged exposure to a lubricant with EP additives.

Determining how much lubrication is required for a gearbox in a specific mounting orientation is relatively easy. Gearbox manufacturers provide this information in their catalogs, manuals and online. There should also be application support staff available by phone as well as field sales staff who can provide guidance.

Improper Lubricant

A second common cause of failure in gearboxes is the use of inappropriate lubrication. Gearbox manufacturers have identified and tested specific lubricants for use in their products. Whenever possible, it is best to follow these recommendations. The selections they have made are based upon the goal of providing the best possible unit life for the customer. Like lubrication amounts, this information is readily available in catalogs, manuals, online or via phone support.

Beyond having the “best” lubricant for a given gearbox, there are specific lubricant characteristics that are known to damage gears. In worm gearboxes, typically the worm is made of steel and the gear of bronze. Lubricants that include extreme-pressure (EP) additives of sulfur or chlorine will sometimes soften the bronze gear surface, with the result being a reduction in unit life. Many lubricants that are classified as EP will include these chemicals. While it may seem intuitive that an EP lubricant will be appropriate for gearing, in this case it is actually the opposite, as EP additives will accelerate wear on the bronze gear by softening the gear teeth.

In conclusion, since right-angle worm gearboxes are common tools for reducing speed and/or magnifying torque in a wide array of applications, it is important to verify that they are lubricated with the proper type and amount of lubrication. By taking these simple but critical steps, a maintenance staff can help ensure the longest life from their installed gearboxes.

Wednesday, 13 July 2016

When to Use Hard-pipe Lubricant Dispensing

Article extracted from Machinery Lubrication website:
http://www.machinerylubrication.com/Read/29345/hard-pipe-dispensing

In all the plants I have visited, the lubrication systems that seem to save the most time and labor for their maintenance personnel are machines that are hard-piped to either a large bulk oil tank or a large oil tote. While piping machines into a lube source isn’t a new concept, it is one that is rarely seen in practice. Usually you find these types of systems employed at places like power plants with large turbine systems that hold thousands of gallons of oil, but they can be used for countless other applications as well.

Piping supply lines to machines makes sense in several situations. For instance, in many refineries there are countless rows of pumps all using the same lubricant. Since these pumps are stationary and typically operated 24 hours a day, they would be good candidates to be hard-piped together to a large oil tank. Piping to a common lube oil tank greatly reduces the amount of labor required for an oil change and can save as much as 90 percent of the labor costs when compared to the storage and handling of oil drums.

Another situation in which piping a machine to a lube oil tank could be advantageous is when a machine or component has a high oil consumption rate. I have seen some machines leak as much as 300 gallons of oil per week. All of this oil is reclaimed, the machine is taken out of commission, and then new oil is added until it is cleared to be returned to service. In these types of scenarios, having a direct line to a bulk oil tank not only would reduce the labor costs associated with handling drums but would also greatly decrease the amount of time the machine is out of service.

When looking at the cost of an oil change, the oil usually accounts for only a small percentage of the total cost, while the cost of downtime or lost production due to the machine being out of service accounts for a much higher percentage. So you are saving money from the labor needed to handle the oil as well as by returning machines into service much quicker.


Hard-piping machines to a fixed oil supply is one way
to address a lack of available labor to handle oils.
One other factor in determining whether this type of system is appropriate for your facility is if there is enough manpower onsite to handle lubricants. If the plant is understaffed, oil changes are generally done haphazardly and only when something breaks down. This leads to the plant’s overall machinery reliability being very low. Piping machines to a fixed oil supply is one way to address the lack of available labor to handle oils. Since this reduces the amount of hours it takes to perform an oil change, the plant can run more efficiently with the staff it already employs.

Understanding when to hard-pipe a system to oil supplies is only part of the issue. You must also weigh the risks vs. the rewards to ensure that it will be worth the initial investment. With that said, one of the largest drawbacks to these systems is the up-front costs, as some of the components can be very expensive. Not only must you purchase the piping material and fittings, but there are also pumps, valves, flow meters and the tank from which the oil will be pumped.

The material cost is one side of the equation; the other side is the labor cost to install all of the hardware and components. This is a labor-intensive project, especially if a storage tank must be erected to house the lubricant. When completed, the system will begin to recoup some of the costs associated with the installation, but the payback period will vary based on the amount of labor saved and downtime reduced.

Advantages of Hard-Piping

  • Low cost of labor to store and handle lubricants
  • Online filtration and fluid conditioning
  • Low new-oil waste
  • Online oil analysis
  • Lower cost of bulk oil
  • No drum deposits
  • Low risk of the wrong oil use

Disadvantages of Hard-Piping

  • High cost to install pumps, valves, piping, volume meters, storage containers, etc.
  • Risk of high-volume leakage
  • Lines running outdoors exposed to temperature extremes
  • Defective new lubricant exposed to all machines

Another disadvantage of hard-piping systems is the risk of a high-volume leak. Since more oil is stored in a much larger volume, any leak is amplified by the amount of oil volume the system can hold. Proper monitoring and installation will mitigate leaks, but periodic inspections of all fittings and tanks are paramount to ensure any leakage or environmental impact is kept to a minimum.

The advantage of storing large amounts of oil onsite is the cost savings associated with purchasing oil in bulk volumes as opposed to drums. Generally, the larger volumes of oil you buy, the greater the discount you receive. In addition, there will be less drum inventory to be kept on hand. Of course, not all facilities utilize enough oil for piped lubricant systems to be cost-effective.

60%of plants have machines that are hard-piped to a large bulk oil tank or a large oil tote, based on a recent poll at machinerylubrication.com

Beware of buying tanker trucks full of oil. If the truck is filled with the wrong oil or a bad batch of oil, all of the machines piped to the storage tank will be at risk of receiving this bad oil. The only way to ensure the oil quality coming in is to sample each compartment of the truck before it is loaded into the storage tank.

A bulk storage system complete with piping offers many great sampling opportunities so you can be confident that the machines attached to it are receiving oil that is clean, cool and dry. If you are able to deliver lubricant to your machines with those three qualities, no matter how it gets there, the machines will have a longer life and run more efficiently.


About the Author
Wes Cash is a senior technical consultant with Noria Corporation, focusing on machinery lubrication and maintenance in support of Noria's Lubrication Program Development (LPD). He holds a ... 

Thursday, 30 June 2016

How to Optimize the State of Lubrication

Article extract from Machinery Lubrication newsletter: http://www.machinerylubrication.com/Read/29278/optimize-lubrication-state

I remember my first day at a new job in 1981. This is the job that launched me into a 32-year career in lubrication. My first assignment was to conduct a telephone survey of industry professionals on various topics related to oil analysis and contamination control. I quickly learned that the industry was suffering from stagnant practices and lethargic attitudes. It was not too long thereafter when I began to have second thoughts about the wisdom of pursuing lubrication as a career path. Perhaps some of you have had similar feelings.
It took a while, but I eventually came to realize that what seemed like a dismal state in an old and generally unexciting field was actually a huge opportunity in disguise. It reminds me of the story of the two shoe salesmen. They were both sent by their factory to Africa to see if there was a market for their product. The first salesman quickly reported back: “This is a terrible business opportunity. No one wears shoes.” The second salesman reported back: “This is a fantastic business opportunity. No one wears shoes.” At first I saw the lubrication field like the first salesman. I soon came to realize the enormous potential that it actually represented.

The Optimum Reference State

The lubricant Optimum Reference State (ORS) is a critical concept in the journey to world-class lubrication and enhanced machine reliability. In short, it is the prescribed state of machine configuration, operating conditions and maintenance activities required to achieve and sustain specific reliability objectives. Lubrication excellence is achieved when the current state of lubrication approaches that of the Optimum Reference State.
There are many different critical attributes of the ORS. These attributes relate to people preparedness, machine preparedness, precision lubricants, precision lubrication and oil analysis. Achieving the ORS almost always involves change or modifications. Each attribute must be:
  1. Precise and definable (e.g., a specific lubricant sump level),
  2. Measurable (e.g., a specific viscosity) or verifiable (e.g., a sample port location),
  3. Controllable (by modification) and sustainable (by program continuity),
  4. Able to achieve the desired reliability objectives related to the financial benefit, safety and machine readiness.
Now decades later it is gratifying to see the considerable progress that has been made in the world of lubrication. Of course, much work still remains. It’s this unfinished business that offers untapped opportunity for both users and vendors alike. Many have seen this opportunity and are moving in to capitalize, but there is still plenty more low-hanging fruit for those who have the vision and are willing to take on the challenge. As they say, “opportunity knocks.”

Lessons Learned

Now, 32 years later, I’ve compiled a list of “lessons learned” related to my experience in lubrication and oil analysis. Lurking within these lessons are many of the opportunities to which I am referring. While these themes may be viewed as old news and certainly not profound, they are fundamental concepts that are largely underdeveloped and, in my opinion, need to be understood as the foundation of any transformational strategy by users.
Among these lessons learned include:
  • Lubrication is heavily influenced by behavior science. Machines fail largely by human agency, i.e., things you do that you shouldn’t and things you don’t do that you should. Critical to this is behavior that is influenced by culture, reward, recognition and attitude.
  • Lubricant-induced machine failure is highly controllable. The greatest amount of this control lies with the user organization. However, original equipment manufacturers (OEMs), lubricant suppliers, component suppliers and laboratories also have great influence on machine service life. See Figure 2 on page 4 relating to the attributes of the Optimum Reference State (ORS) and where there is the most “control,” as well as the sidebar (left) that defines the Optimum Reference State.
  • Clean, dry and cool lubricants yield huge reliability returns (proactive maintenance). The majority of the case studies Machinery Lubrication has published relate to this basic strategy. Proactive maintenance monitors and eradicates root causes before serious harm is done. Few root causes are as important to control as particles, moisture and excessive heat.
  • Lubricant starvation is a pervasive, yet largely unrecognized cause of premature machine failure. Moderate lubricant starvation is often difficult or impossible to detect. I recently wrote an article on this (see www.machinerylubrication.com/Read/29040/lubricant-starvation-dangers). Understandably, lubricant starvation impairs the basic functions of lubrication. Examine the subtle and countless ways starvation occurs.
  • Skillful, daily one-minute inspections are very effective at early detection of many common lubrication problems. This sounds simple enough, but most routine inspections are horribly inadequate (e.g., limited to such things as oil level and leakage). Blatant opportunities to detect and correct problems are generally unexploited.
  • Users typically only get about 10 percent of the available benefit from oil analysis. Most oil analysis programs have been whittled down to the bare minimum and are run by unskilled onsite personnel. Many critical improvements relating to the quality of sampling, frequency of sampling, quality of the test slate and interpretation methodology often remain untouched.
  • Education enriches the maintenance culture and is a strong impetus to change and improve the lubrication program. As educators, we’ve been closely monitoring the progress of our clients in advancing their lubrication programs. It’s of little surprise that there is a correlation between the extent of program success and the level of education by personnel.
  • Procedure-based maintenance strengthens the awareness and importance of correctly performed tasks. Lack of procedures conveys that doing tasks any which way is good enough. Documenting best practice in work procedures conveys the need to do the right things right the first time and every time.
  • Machine criticality and other risk factors should be used to properly establish maintenance priorities and focus resources. Controlling every possible failure root cause for each machine in a plant is wasteful and generally overwhelming. Knowing both the probability and consequences of machine failure is a much better way to optimize a program transformation.

Accelerating Adoption of Optimum Plant Lubrication

Why are plants so slow in adopting and deploying optimum lubrication practices? This question has befuddled industry professionals for years. The basic attributes of the Optimum Reference State (ORS) are widely known and are certainly deployable. The benefits are also well-documented by countless case studies, and the risks and costs are relatively low. So why hasn’t the ORS reached a usage tipping point?
I think a big part of the answer might lie in the Technology Acceptance Model (TAM), which was first introduced by Fred Davis. This widely referenced theory states that users come to accept and use a new technology according to a number of factors. These factors influence the decision of how and when it will be used, specifically:
Perceived usefulness - This is defined as “the degree to which a person believes that using a particular technology would enhance his or her job performance.” For instance, how do better contamination control practices influence the jobs of maintenance managers and their workers?
Perceived ease of use - Davis defined this as “the degree to which a person believes that using a particular technology would be free from effort.” In lubrication, maintaining the status quo is easy, while implementing modernized lubrication practices can be viewed as difficult, expensive and disruptive (during the deployment period).
The basic elements of the TAM are shown in Figure 1. This has many parallels to the challenges facing the lubrication industry. The very fact that adoption of optimum lubrication practices has been so delinquent makes the case that one or two of these elements have strained progress.

Figure 1. This relational diagram illustrates the elements of the Technology Acceptance Model (TAM).
Fundamentally, there is a need for users to believe that optimized lubrication: 1) is considerably different from the current state of lubrication in many critical areas, 2) will bring real value to users’ organizations and to maintenance workers individually (financially and career development), 3) can be deployed with manageable risk and cost, and 4) is sustainable.
An even more common model is the Technology Adoption Cycle. This model separates users (customers) into groups based on their propensity to try new technology. These groups are listed and summarized according to several unique characteristics, such as:
  • Innovators – These highly educated, leading-edge individuals are often viewed as risk takers.
  • Early Adopters – This is a young, well-educated group of leaders (willing to champion innovative ideas).
  • Early Majority – This group is conservative but open to continuous improvement.
  • Late Majority – These individuals are older, less educated, fairly conservative and less influenced by social or technology trends.
  • Laggards – This group is very conservative, oldest, least educated and slow to change.
These groups form an adoption timeline as shown in Figure 3. In his book Crossing the Chasm, Geoffrey Moore makes a modification to the graph by adding what he calls “the chasm.” He states that progress along the timeline critically depends on crossing this chasm. The chasm is the point at which most new technologies fail to become mainstream in the market. Companies who introduce these new technologies can flounder due to their failure to reach the critical mass that enables the chasm to eventually be crossed.

Figure 2. This table shows critical lubrication Optimum Reference State (ORS) attributes and responsibility in controlling these attributes. Note that retroactive responsibility relates to machine modifications after installation at the user’s site.
In the world of lubrication, the changes needed by users to reach the Optimum Reference State could be viewed as the same in principle as a new, evolving technology. Many of the elements or attributes that make up the ORS are in fact technologies, while others are methods. These ORS technologies include advanced lubricant formulations, oil analysis instruments, lubrication devices, inspection tools and others. Instead of one single technology, like a smartphone, the ORS represents a collection of methods and technologies. To the user, this can be perceived as overwhelmingly difficult and hard to figure out. In other words, there is a perception of deployment risk and a potential failure to “cross the chasm.”

Optimum Reliable Plant by Outsourcing

The state of machine and plant reliability should not be maximized but instead optimized. In lubrication, and maintenance in general, the goal is precision, i.e., the precise lubricant, the precise amount of lubricant, the precise inspection method, the precise relubrication frequencies, etc. The Optimum Reliable Plant (ORP) is one that approaches the ORS in all areas that enable reliability, with lubrication being one of the most critical.

Figure 3. The Technology Adoption Cycle was modified by Geoffrey Moore to include “the chasm,” where most new technologies fail to become mainstream in the market.
Many of us, including Noria, are stakeholders in the lubrication industry, while others are users or vendors of products and services. Getting over the chasm in the adoption cycle is in everyone’s interest. There is no secret formula, just a lot of critically important work that must be done. Procrastination is perhaps the greatest risk. Some specialized skills and tools are needed. It’s best to find experienced professionals with expertise in the critical attributes of the Optimum Reference State. Sadly, old-timers may lead you in the wrong direction unless their skills have been refreshed from recent training.
Strongly consider outsourcing as an option to avoid the need to hire or develop the internal resources required to cross the chasm. This could also avert the risk of losing focus from other routine and operational priorities. Service providers, such as Noria, can supply the needed expertise to facilitate (or turnkey) the transformation to the Optimum Reliable Plant. Among the services available include training, machine modification, procedure development, oil analysis program development, lubricant consolidation, lube room modernization and many others.

Monday, 7 July 2014

Introduction to filters (Engine Oil Bypass Filtration)

Article extract from Reliable plant newsletter:
http://www.machinerylubrication.com/Read/29026/engine-bypass-filtration

Understanding Engine Oil Bypass Filtration

Is your engine’s oil filter performing to your expectation? Do you even know the performance of your filter? Most people don’t, and if they did, they would be appalled.

Some of the best full-flow engine filters on the market perform at a capture efficiency of 50 percent at a particle size of 10 microns and above. That’s a beta ratio of 2 for those of you keeping score, and these are considered “good” in terms of full-flow engine filtration. In comparison, a beta ratio of 1,000 would be considered “good” in terms of industrial hydraulic filtration. Why is there such a performance difference? The following factors contribute to the variance:

Physical Size

Often limited by physical size, engine oil filters are relatively small when compared to their industrial counterparts. This small size coincides with less filter media surface area through which to pass the lubricant.
65% of lubrication professionals use bypass filtration systems at their plant, based on a recent poll at machinerylubrication.com

Pressure Differential

The pressure differential is the change in pressure from the inlet to the outlet side of the filter. If the pressure differential is too high, a valve will open, allowing the oil to bypass the filter. All engine oil filters or heads are equipped with a bypass valve. This valve is needed so the engine does not become starved of oil as the filter clogs with debris.

The Beta Ratio Test

Oil filters can be tested in a variety of ways, but one of the most common methods is the beta ratio test. This test incorporates online particle counters positioned upstream and downstream of the filter, a continuous flow of test contaminant into the main system reservoir and oil flowing through the filter.

The beta ratio is calculated by dividing the number of particles larger than a certain size upstream of the filter by the number of particles of the same size downstream of the filter. For example, you may have a beta ratio or a beta sub 5 (meaning particles larger than 5 microns) equal to 10. This means 10 particles upstream of the filter would be divided by 1 downstream of the filter. In other words, for every 10 particles coming in, one gets through.

If you have a higher beta ratio, say a beta ratio of 100 or a beta sub 5 equal to 100, for every 100 particles coming into the filter larger than 5 microns, one makes its way through.

Every filter will have multiple beta ratios. There could be a beta ratio for 2 microns, 5 microns, 10 microns, 50 microns, 100 microns, etc.
You can also use the beta ratio to calculate capture efficiency, which is the average performance over the filter’s life, with the following formula:
((Beta – 1)/Beta) x 100 As an example, a beta ratio of 10 would yield a capture efficiency of 90 percent:
((10 – 1) / 10) x 100 = 90 percent Therefore, 90 percent of the particles larger than 5 microns are removed by a filter that has a beta ratio of 10.

Flow Rate

In most engine designs, oil must flow through the filter before entering the engine components. Therefore, the filter must be able to handle 100 percent of the flow rate needed to feed the moving components of the engine.

Media Pore Size

The media pore size is the major determinant in how efficient and how small of a particle the filter can remove.

When these factors are combined, a problem arises. The physical size is usually constrained by design. The filter can’t be too large because of all the other components that we are trying to fit under the hood. The flow rate must be high enough to feed all the lubricated components. This means you can’t make the pore size too small or it will raise the pressure differential and the bypass valve will open, effectively rendering the filter useless.

There are a few things you can do to remedy this problem. Enter bypass filtration. Bypass filtration systems take 5 to 10 percent of the flow that would have gone to feed the engine and cycle it through an ultra-efficient filter and back to the sump.

With bypass filtration, the flow rate can be greatly reduced, allowing for a much smaller pore size while retaining a normal pressure differential. The result is much cleaner oil being returned to the sump. Smaller soot suspension and polar insolubles that are not controlled by the full-flow filter can now be taken out of the system. When combined with a full-flow filter, bypass filtration offers the benefits of lower wear generation rates, lower oil consumption, higher combustion efficiency and longer oil life.

In a case study performed by General Motors and published by the Society of Automotive Engineers (SAE), it was determined that engine service life could be extended eight times when 5-micron filtration is implemented vs. the standard 40-micron filtration.

Obviously, having cleaner oil is better for the reliability of the engine. There’s an old saying that oil doesn’t wear out; it just gets dirty. Although there is some validity to the idea that dirtier oil will “age” quicker than clean oil, the engine oil will have a finite life. It will need to be changed eventually no matter how clean you keep it.

While it’s true that a system can remove the majority of suspended soot, wear debris and dirt, the oil and additives are still being decomposed by oxidation and nitration. The depletion of these additives will ultimately be the reason for the oil change. The system should slow down the rate of this depletion, but it cannot eliminate it. Acids, fuel and coolant are just a few of the contaminants that bypass filtration cannot address. They too can shorten the life of the oil.

If you are shopping for one of these systems, it is vital that you do your homework. Not all bypass systems are created equal, and there is a plethora of marketing material out there to make you feel thoroughly confused. Keep in mind that while testimonials may seem impressive, they are not scientific proof. Make sure the manufacturer has SAE and ISO testing to back up its claims.

When installed and maintained properly, a bypass system can provide great benefits. Just be sure to ask all the right questions and have a firm grasp on the concept before settling on a system.

About the Author
Jeremy Wright is a Senior Technical Consultant for Noria Corporation. Hire Jeremy to develop procedures for your lubrication program or to train your team on machinery lubrication best practices. ...

Friday, 5 April 2013

Particle Count in Oil Analysis

A good article from Reliable Plant Newsletter:
http://www.machinerylubrication.com/Read/28974/particles-friend-foe

Particles: Friend or Foe? Understanding the Value of Particles in Oil Analysis


In the field of tribology, the word “particles” means different things to different people. The following case studies illustrate how differently the mechanical engineer, tribologist, sampler, analyst and diagnostician interpret the presence of particles.

The Mechanical Engineer and Tribologist

To the mechanical engineer and tribologist, the presence of particles is an indication that contaminants have entered the system or that certain components are wearing abnormally. Particles that are smaller than the minimum clearances could result in abrasive wear, which in turn causes premature aging or failure. Large particles could result in blockages of oil channels, which could lead to oil starvation. Thus, both conditions spell trouble to these role players.


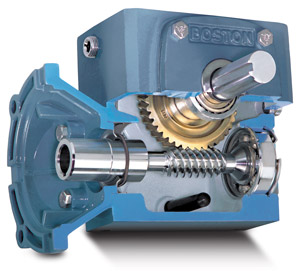
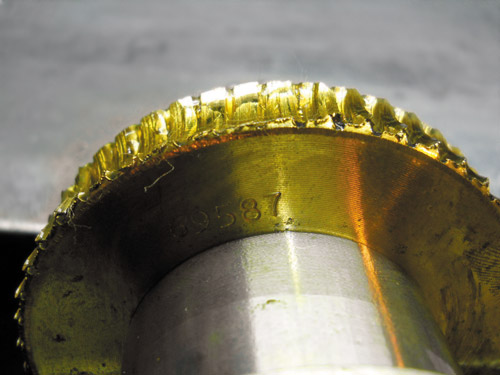
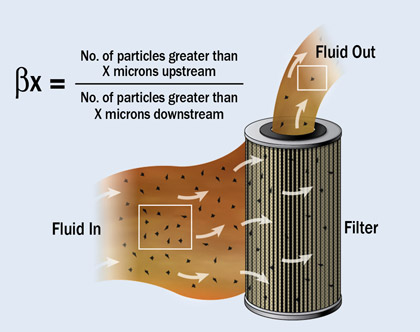
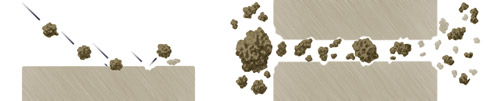
This illustration shows how particles cause damage
to parts in contact. (Ref. Triple-R Oil Cleaner)

The Sampler

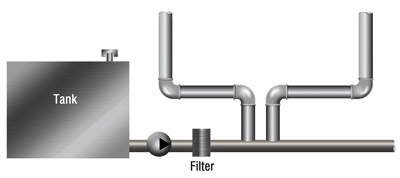
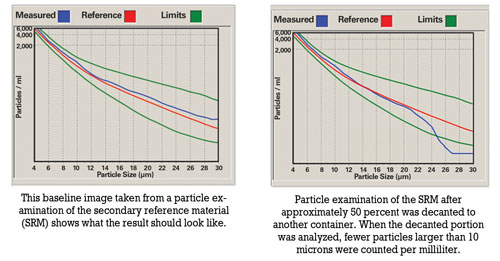
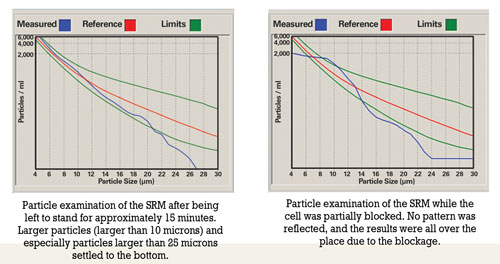
The main concern of the sampler is to produce a homogenous sample that is representative of the bulk volume of oil in the system. The presence of particles complicates the task of the sampler, as particles tend to settle at the bottom of the tank/sump.
Prior to sampling, oil should be hot and well agitated to ensure that the sample includes particles that have settled. For routine oil analysis, the container must not be filled more than 80 percent to enable the laboratory to agitate the sample prior to analysis.
Improper sample handling includes overfilling containers, decanting samples that were originally filled to the top and sampling when the oil has not been circulated sufficiently prior to sampling. Overfilling a container leads to insufficient agitation. Shaking the container prior to decanting will result in large particles remaining at the bottom of the container. There’s also the possibility that the less contaminated portion is decanted, causing the laboratory result to be higher than usual.


 The Analyst

Once the samples reach the laboratory, the presence of particles directs the tasks and methods that the chemical analyst will use to analyze the samples. The method of sample preparation, the analytical techniques and instrumentation required to ensure that the results are representative of the condition existing in the application all depend on the type, size, properties and distribution of the particles present in the samples.
Various analytical techniques, including inductively coupled plasma (ICP) spectrometers, the flow cell of Fourier transform infrared (FTIR) spectrometers and some particle counters, rely on peristaltic pumps and transport systems (tubing) to introduce samples to the various instruments. When large particles are present in samples, the possibility exists that the tubing could become blocked.

68%
of machinerylubrication.com visitors view the presence of particles as a valuable indicator in an oil analysis sample

Analysts also must be aware of the tendency of particles to settle at the bottom of the container. Prior to each analysis, samples should be agitated sufficiently to ensure a homogenous state. Lowering of the fluid’s viscosity either due to fuel dilution in the engine or dilution due to analytical requirements (e.g., ICP) aggravates the tendency of particles to settle. With ICP analysis, the samples must be diluted to assist with the transportation process. Due to dilution, suspended particles are more prone to settle out on the bottom of the test tube and will not be available for analysis. However, no dilution is required with rotating disk electrode (RDE) analysis.

The Diagnostician

Particles can be of value to a diagnostician who studies the shape and nature of particles found in a sample. A scanning electron microscope (SEM) can assist in investigating the root cause of mechanical failure by allowing the diagnostician to pay special attention to evidence such as scratch marks on particles and methods of particle formation.
Fine filtration is a proactive process aimed at removing contamination and wear particles from the system. If this process is not executed with special care, knowledge and sensitivity to the value that particles add for the diagnostician in root-cause analysis, crucial evidence can be lost.

Case Study #1: RDE vs. ICP Spectrometry

In 2002 the Eskom laboratory changed from ICP to RDE spectrometry to perform wear metal analysis on used oils. To obtain a new baseline, it was essential to perform both spectrometric methods as well as the ferrous particle quantifier (PQ) on all samples received for a three-month period.
When the spectrometric results were plotted against the PQ values, it was determined that the higher the PQ value was for a sample, the greater the difference between the ICP and RDE results. For a PQ value of 15 milligrams of iron per liter (mg/l Fe), the expected difference between the two techniques was about 0 to 5 ppm. However, above a PQ value of approximately 75 mg/l Fe, the relation seemed to become non-linear, where the differences between ICP and RDE results were from 50 to more than 500 ppm.


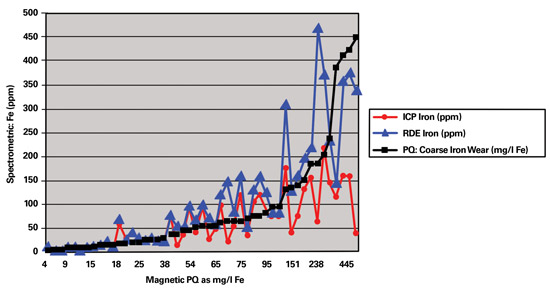
 This graph charts the relationship between RDE and ICP relative to PQ
as determined on samples of different sources.
One sample with a PQ value of 1,712 mg/l Fe had an iron value of 699 ppm with ICP. The result on the RDE for this same sample was found to be in the region of 3,000 ppm. The difference in results obtained by the two spectrometric methods was as high as 2,300 ppm.
When the wear trends of the unit with the PQ value of 1,712 mg/l Fe were examined, the ICP results gave the impression that the problem was either resolved or stabilized. However, when the RDE results became available, it was evident that there was an increase in wear. The final report recommended the unit be shut down for emergency maintenance.
Due to the lower particle size limitation of the ICP, a plateau was reached much sooner than with the RDE. Applications most affected by the ICP’s lower size limitation were those that did not have internal oil filtration systems such as gearboxes and certain compressors.
Geometry of the particles being analyzed by the RDE also affected the results. For example, if thin flakes of metal were present in the sample, flakes that had flattened out on the RDE gave a different reading than particles that had not flattened out. Thus, the results on the RDE varied due to the particle size as well as the geometry of the particles.

Case Study #2: Severe Scratching in a Locomotive Engine

The engine of a particular locomotive was replaced with a newly refurbished engine. When the engine was installed, the maintenance team had difficulty eliminating abnormal vibration in the engine. Eventually, it was determined that a bent flywheel caused the vibration.
As soon as the vibration problem was eliminated, scratching noises were audible. Everything was checked, yet the source of this noise could not be traced. The maintenance engineer decided to involve the laboratory that performed the oil monitoring program in the investigation.
Since the engine was recently refurbished and the original source was unknown, the laboratory had no history on which to base the diagnosis. To obtain more knowledge about the solid content of the oil sample, the lab employed specialized methods, such as the electron diffraction X-ray (EDX) scan technique using the SEM.
To find out if the noise was due to insufficient lubrication, the laboratory determined the oil’s viscosity. This was to establish if metal-to-metal contact had occurred as a result of the oil being too thin. A new oil sample of the specified lubricant was submitted for comparison with the oil sample taken from the engine.
A PQ analysis was then conducted to determine the magnetic property of the oil, followed by spectrometric elemental analysis using RDE spectrometry. An EDX scan using the SEM was performed on particles caught after the sample was filtered through a 0.8-micron-filter membrane and rinsed with pentane to remove oil residue.
The results revealed that the viscosity was acceptable when compared to that of the reference sample, while the PQ values were very high (more than 1,000 mg/l Fe). The RDE spectrometric analysis indicated an increase in copper, iron and zinc when compared to that of the reference sample.
The EDX scan using the SEM found the following components on the filter:
  • High occurrence of white metal bearing material
  • Metal frets
  • Iron, lead and copper shavings with scratch marks
  • Metallic iron shaving with lead bound to it
  • Zinc particles not in combination with copper
  • Mineral/rock/soil containing calcium phosphate
  • and calcium silicate
  • Silicon and aluminum silicate
  • A piece of silicone

Ionization Energy and Spectrometric Analysis

The available ionization energy to energize large particles reaches a plateau, which is one of the reasons different spectrometric methods have limitations concerning particle size (3 microns maximum for ICP and 8 to 10 microns maximum for an RDE spectrometer).
Spectrometers, as they are applied today, are blind to large particles. Traditional methods of determining large particles (larger than 10 microns) are acid digestion (expensive and hazardous), microwave digestion (expensive and time consuming) and direct ferrography (does not include non-ferrous metals).
Rotrode filter spectroscopy (RFS) was developed to provide an improved spectroscopic method for analysis of used oils for condition monitoring/predictive maintenance without the particle size or metal-type limitations of previous combined spectrochemical and direct ferrographic techniques.


 Particles as Enemies

Special evidence, such as the scratch marks on the metal frets, suggested that uneven objects (particles) were responsible for abnormal wear of the liner and/or the crankshaft. The piece of silicone found indicated overuse of a silicone-containing substance like a sealant, which possibly was squeezed out between parts, cured and ripped off by the hot flowing oil. These silicone pieces could have blocked oil passages, resulting in a damaging situation of oil starvation.
Particles including silicon (quartz) and sand (aluminum silicate) as well as other debris discovered in the oil sample were responsible for the abnormally high wear. Since abrasive wear was the main cause of premature aging and resulted in severe damage to the parts in contact with these objects, the maintenance engineer wanted the reason for the initial ingress of those particles into the system to be investigated.
For the sampler, it was essential to ensure that as much evidence as possible was captured in the drawn sample. In this case, where the ultimate failure would have been catastrophic, the task could have been quite difficult, since all particles had settled to the bottom as the oil cooled. Thus, a typical sample drawn in the normal fashion may not have allowed all the evidence to be captured.

Particles as Friends

By unlocking the treasure of evidence that was captured in the particles found in the oil, the diagnostician obtained information about the formation of such particles. The presence of metal shavings indicated possible misalignment. Lack of lubrication also was detected, which possibly was due to blocked oil channels resulting from the presence of foreign particles. The metallic iron shaving with lead bound to it suggested welding due to oil starvation (metal-to-metal contact).
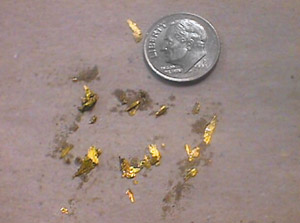
The discovery of a particle with scratch marks led to an investigation of objects that could have been responsible for the damage. One possible culprit was detected in a particle consisting of calcium phosphate and calcium silicate. This specific mineral (possibly apatite) together with particles containing quartz and sand led to the conclusion that the engine originated from a locomotive that was involved in an accident with subsequent derailment where soil was introduced to the engine. Evidently, the soil was not removed successfully when the engine was refurbished.


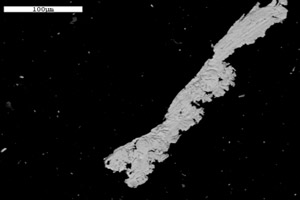
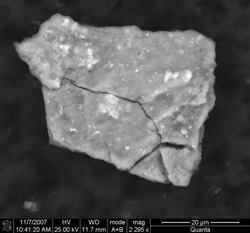
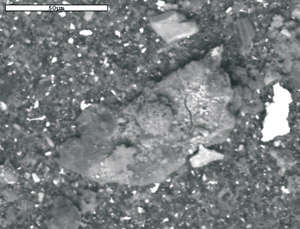
An iron shaving with scratch marks (top) and soil (above) were found in the oil sample.

Case Study #3: Wrist Pin Bearing Failure on a Diesel Locomotive

Prior to a wrist pin bearing failure, oil samples from a diesel locomotive were sent to two different laboratories for routine oil analysis. The first laboratory issued wear alerts on possible wrist pin bearing wear four weeks prior to the failure, while the second laboratory indicated no abnormal wear was taking place. A resample was taken, and again the second lab did not find any abnormal wear, while the first lab issued another wear alert.
The fleet owner decided to stop the locomotive to find out whether the alerts issued by the first laboratory were justified. It was discovered that the wrist pin bearing had failed with damage to four power packs. An investigation was launched to determine the root cause that resulted in the different diagnoses from the two laboratories.
Routine oil monitoring tests were performed, including spectrometric analysis using RDE spectrometry and PQ. An EDX analysis using the SEM on the filter debris was conducted after the sample was filtered through a 0.8-micron-filter membrane and rinsed with pentane to remove oil residue. The results of the RDE spectrometric analysis revealed an increase in silver, copper and iron, while the SEM analysis confirmed the presence of particles larger than 10 microns.
Since both laboratories performed similar analysis on a routine basis, the investigation focused on the differences in the techniques used by the two labs. The only major difference found was that the laboratories employed different spectrometric techniques to determine the wear metal content of the samples, namely ICP and RDE spectrometry.


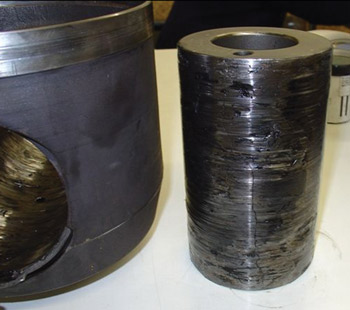
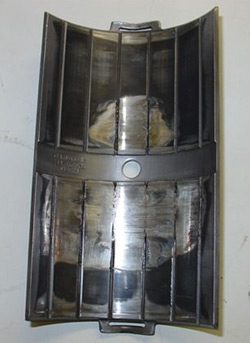
These images of a locomotive engine
reveal wrist pin bearing failure.

The primary variation between the two techniques is the way the sample is introduced to the system. For ICP analysis, the sample is diluted prior to introduction to the instrument. Therefore, it’s possible that the particles settled prior to analysis. The ICP also uses a peristaltic pump and transport system, which is subject to blockages.
In addition, the size limitation of the ICP is 1 to 3 microns, while the range of the RDE is 8 to 10 microns. The SEM analysis confirmed the presence of particles larger than 5 microns, so it seems the failure progressed beyond the point where the ICP could detect the wear particles but remained within the range of the RDE.

Case Study #4: Scored Liner and Piston Wear on a Diesel Locomotive

As part of an oil analysis program, the crankcase oil of a locomotive was monitored on a monthly basis. However, no samples were received for the period between January and the end of June. The engine failed at the end of September.
The reason for concern was that all laboratory reports returned with no indication of an increase in wear metal content. An investigation was initiated to explain why the laboratory tests failed to detect any increase in wear when it was evident that abnormal wear was taking place from the mechanical failure that occurred.
Since no abnormalities were found except for fuel dilution over a prolonged period, the investigation focused on sampling intervals and techniques that could have affected the results.
Routine oil monitoring tests, including spectrometric analysis using RDE spectrometry, were performed, as well as EDX analysis using the SEM on the filter debris after the sample was filtered through a 0.8-micron-filter membrane and rinsed with pentane to remove oil residue.
The results showed severe fuel dilution. The RDE spectrometry indicated no increase in metal content since the previous sample was analyzed. The EDX analysis revealed that isolated large particles (larger than 20 microns) of heavy metals and other inorganic oxides were present on the filter. Many of the larger particles were iron or iron oxides. The small particles consisted mainly of calcium sulphate.
 

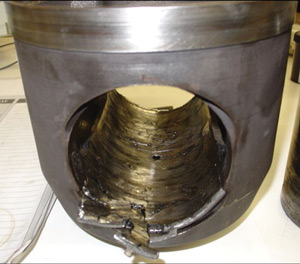
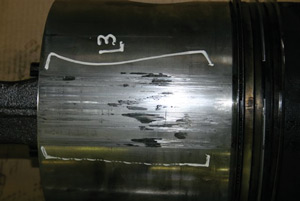
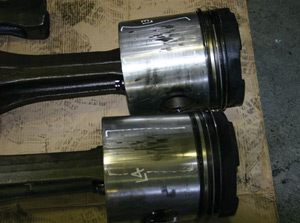
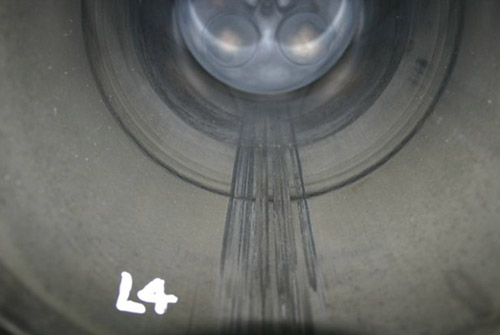
These photos of a locomotive engine indicate a severely scored liner and piston wear.

Lowering of the fluid’s viscosity, which may have resulted from fuel dilution in the engine, aggravated the tendency of particles to settle. Therefore, it is possible that suspended particles had settled to the bottom of the sump and were not included in the sample.
In the earlier stages of failure, smaller particles were produced (likely during the period when no samples were submitted). As the failure progressed, the size of the particles increased. Since particles larger than 10 microns were found, it is possible that the failure progressed beyond the point where the RDE could detect the wear particles. Thus, severe fuel dilution over a prolonged period of time combined with not submitting oil samples at the initial stages of failure resulted in the inability to detect the failure through a routine oil analysis program.

A particle larger than 20 microns
was found in the oil sample.

In conclusion, it is apparent that removal of particles from a system prior to sampling by means of indiscriminate filtration, improper sample handling and settling of particles can result in the loss of important evidence that could lead to the early detection of possible failures or assist in root-cause analysis.
Remember, the purpose of oil analysis is to avoid failure before it happens. Sensitivity with regards to particle sizes and size limitations of analytical techniques relative to sampling intervals is vital to reach this ultimate goal. In the end, the success of an oil analysis program to detect possible failure modes relies on the ability of the mechanical engineer, tribologist, sampler, analyst and diagnostician to treat and react to the presence of particles in the appropriate manner.